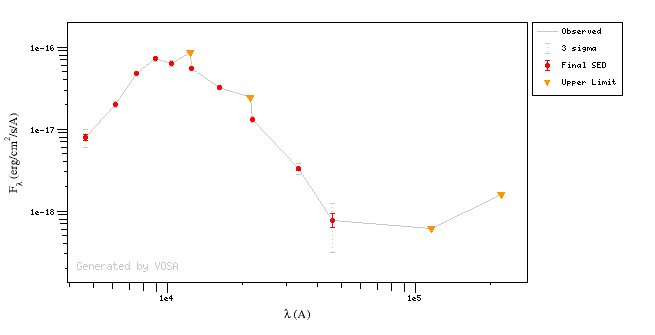
Upper LimitsIn some cases, there are points in the SED marked as "upper limit" (because VO catalogs label them as that, or because the user has marked the corresponding option at the 'edit SED' tab.
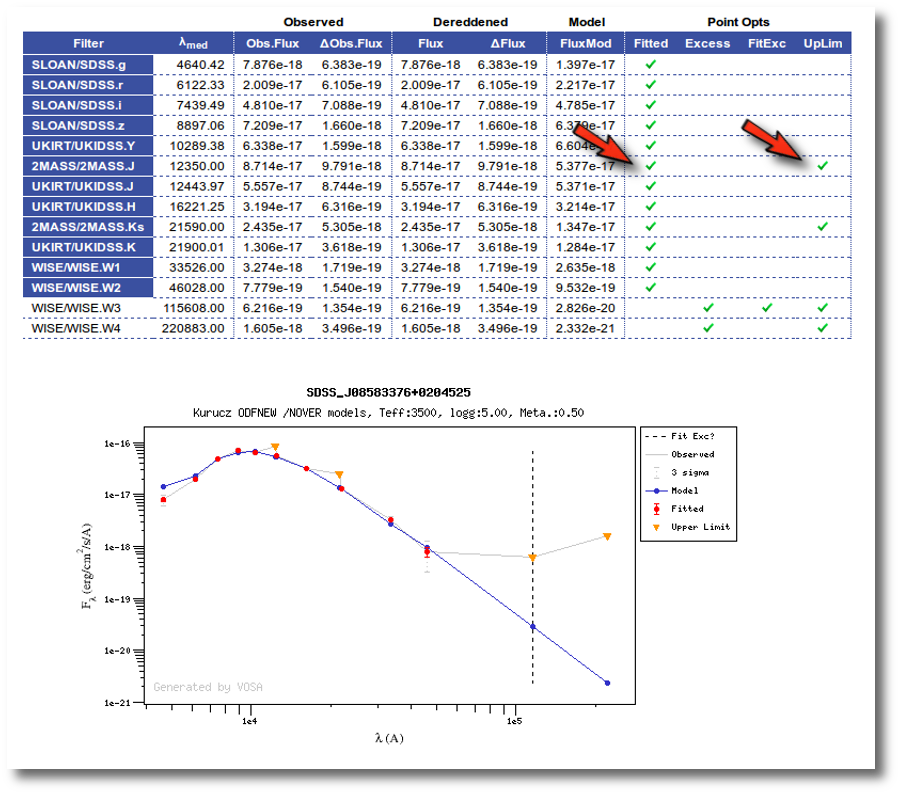
These points are displayed in the SED plots with a triangle instead of a dot.

Photometric points marked as "upper limit" are taken into account for the chi2 and bayes analysis but in a different way than the other points.
To perform the corresponding fit an upper limit with flux ${\rm F}_{uplim}$ is included in the SED to fit as:
$${\rm Flx} = 0 $$
$$\Delta{\rm Flx} = {\rm F}_{uplim}$$
When the chi2 model fit is performed with the option of estimating parameter uncertainties using a statistical approach, a 100 iteration Monte Carlo simulation is done. In this case, 100 different virtual SEDs are generated introducing a gaussian random noise for each photometric point (proportional to the observational error). But for the upper limits, in the virtual SEDs a random flux will be generated between 0 and ${\rm F}_{uplim}$ following a uniform random distribution.
In the case that the user does not want to treat upperlimits in this way, there is the option to perform the chi2 fit ignoring upperlimits. In that case, these points will not be taken into account at all during the process.
When you visualize the individual fit results, you will see what points are upperlimits and if they have been used for the fit or not.

| 
