PlotsVOSA generates graphs for object SEDs, model fits, bayes analysis, HR diagram...
These graphs are generated and displayed in VOSA as simple PNG files.
But some versions of these graphs are also generated in postscript format and as .agr files.
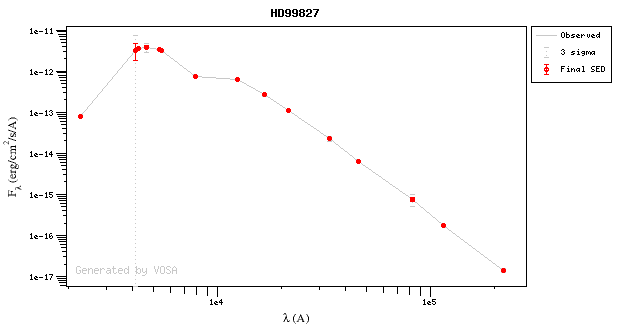
For each plot, for instance, the SED of the HD99827 object, these files are generated:
- HD99827.sed.png : with the SED plot in PNG format.
- HD99827.sed.eps : with a postscript file directly generated fromthe PNG image.
- HD99827.sed.agr : an ascii file that can be used by Grace to manipulate the plot.
- HD99827.sed.agr.eps: a postscript file generated from the Grace plot. This postscript file is usually of better quality.
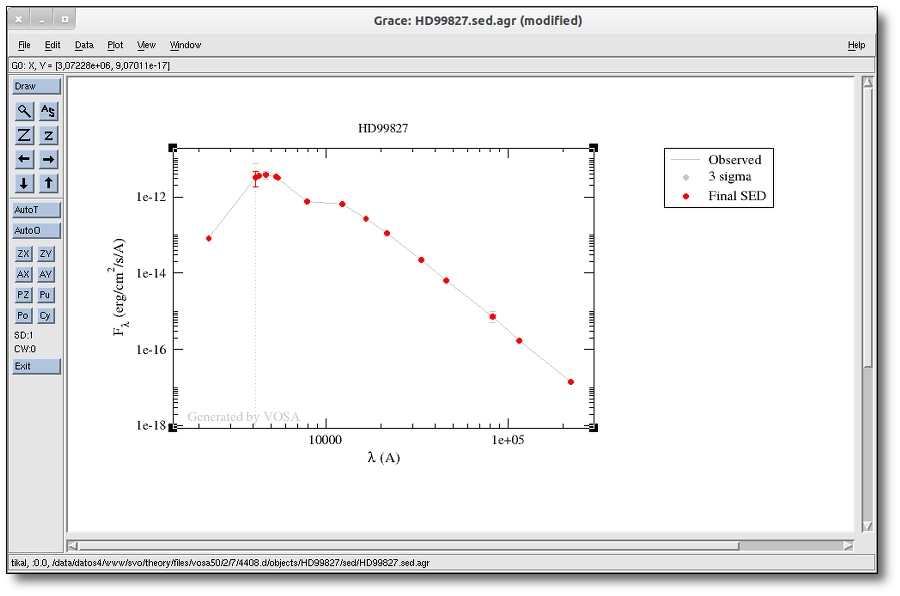
Graphs in Grace format
Grace is a free WYSIWYG 2D plotting tool, developed initially for Unix-like operating systems but also ported to OS/2, Windows, etc.
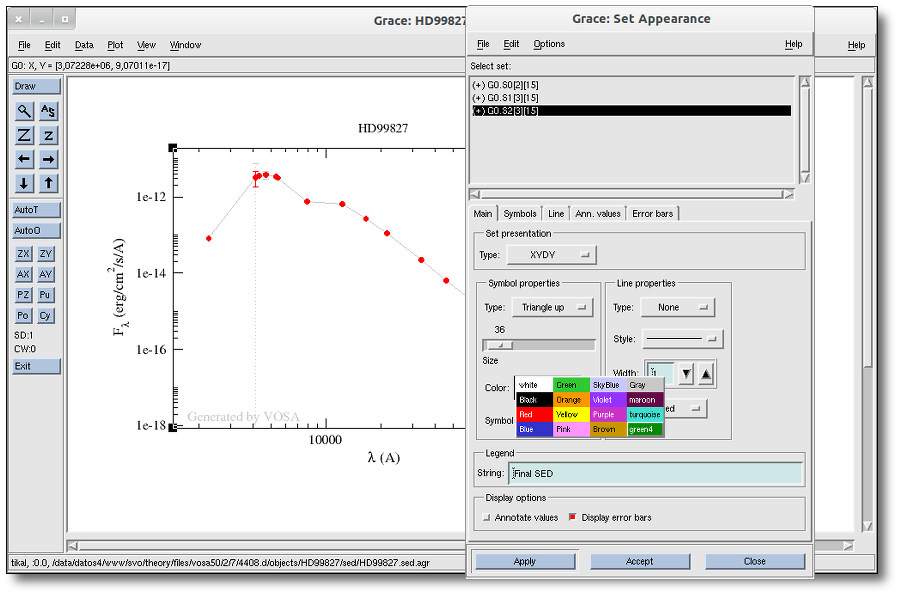
It allows to play with graphics, customize lines, colors, axes, etc., and even apply some analysis options to the data sets.
VOSA generates a .agr version of every plot so that you can use Grace to customize the plot if you feel the need to do it, for instance, to include it in a publication.
You only need to open some of the .agr files generated by VOSA and you will see a plot very similar to the PNG version.
You have many options to customize the graph appearance. As a simple example, you can change the red circles to green triangles:
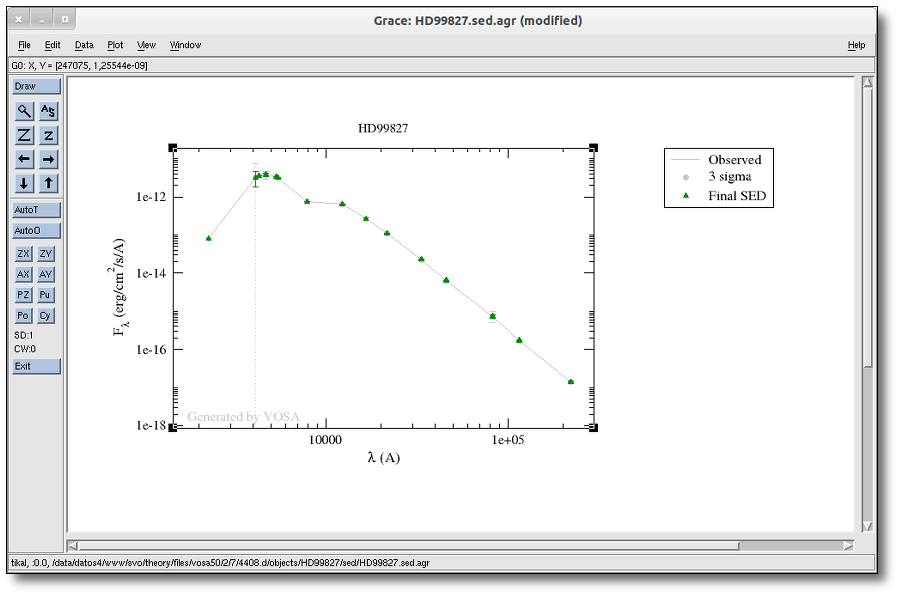
Once you are finished editing the graph, you can use the "File:Print Setup" dialog to specify how you want to save the plot, including PNG, EPS and other formats. Then, use the "File:Print" dialog to generate the final file.
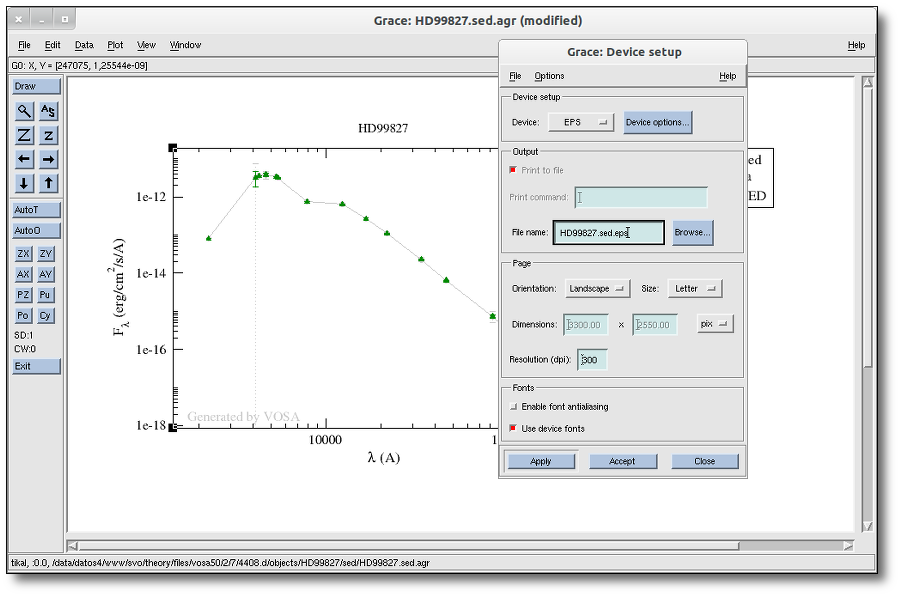
Take a look to the Grace online help for details about how to use the many available options.
| 
 Log file