Template Fit
In some occasions, the limited understanding of the physical processes and/or the nature of some astronomical objects makes the theoretical models failed to reproduce with good accuracy the real observations. In this case, the comparison with benchmark objects, whose properties can be accurately determined without the use of models are largely preferred.
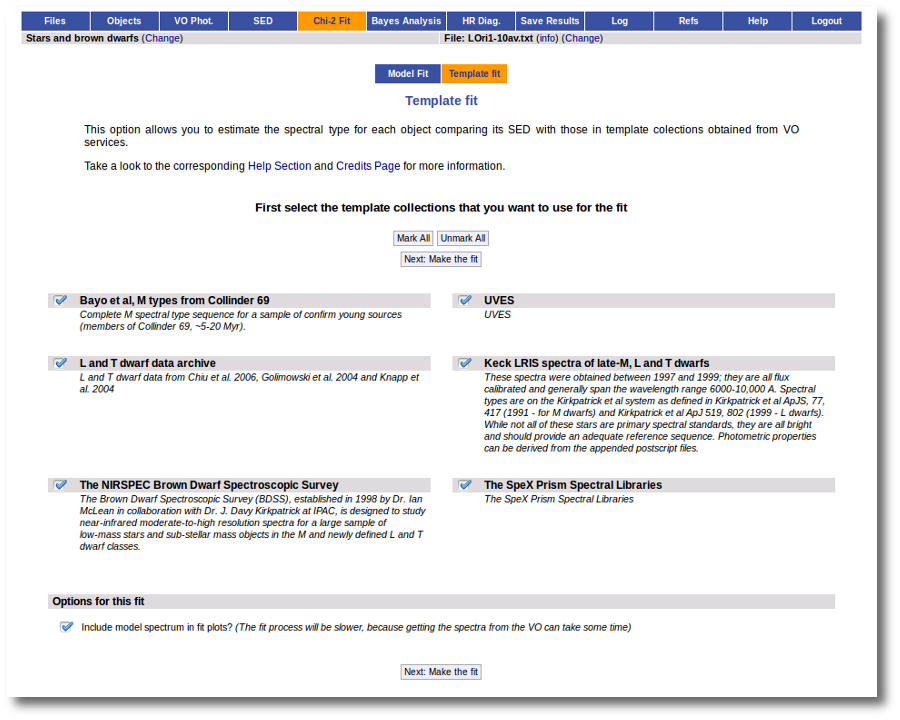
VOSA offers the possibility of performing both the Χ2 fitting and Bayes Analysis with standard objects. Four template collections covering M, L and T spectral types are now available: Chiu et al. (2006); Golimowski et al. (2004); Knapp et al. (2004); Kirkpatrick et al. (1991, 1999), McLean & Kirkpatrick7 and the SpeX Library. Take a look to the corresponding Credits Page for more information about these collections.
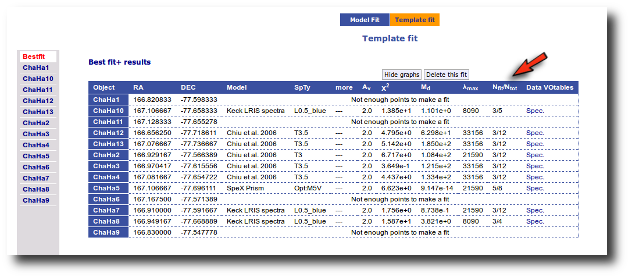
Take into account that these templates are usually the observed espectra of some well known objects and that means that the wavelength coverage of these spectra is not as wide as it is for most theoretical models. This implies that it is not possible to calculate the photometric photometry for all the filters, but only for the ones that are fully covered by the observed spectrum. In practice this means that only a few of the points in the observed SED will be used when comparing with templates. Thus, in some cases you will receive a "Not enough points to make a fit" message (even having quite many points in the SED). In any case, the number of points used for the fit will be shown in the results table and you can see which points have been actually fitted in the plots.
This is the main reason why, for template fitting, the AV extinction parameter is NOT considered a fit parameter. Having extra parameters would imply that less objects could be fitted. The value for AV given in the input file (or specified in the objects:extinction tab) will be used.
An example
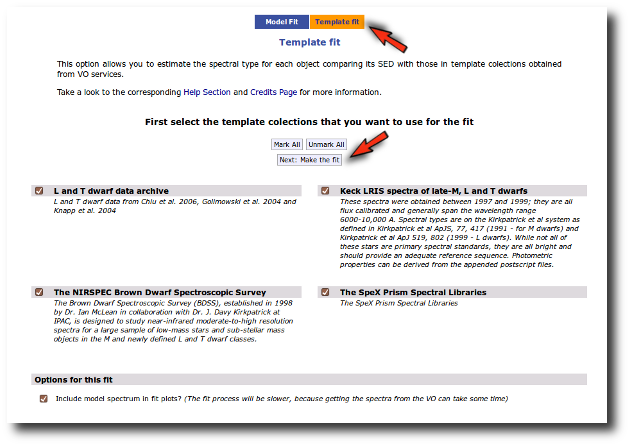
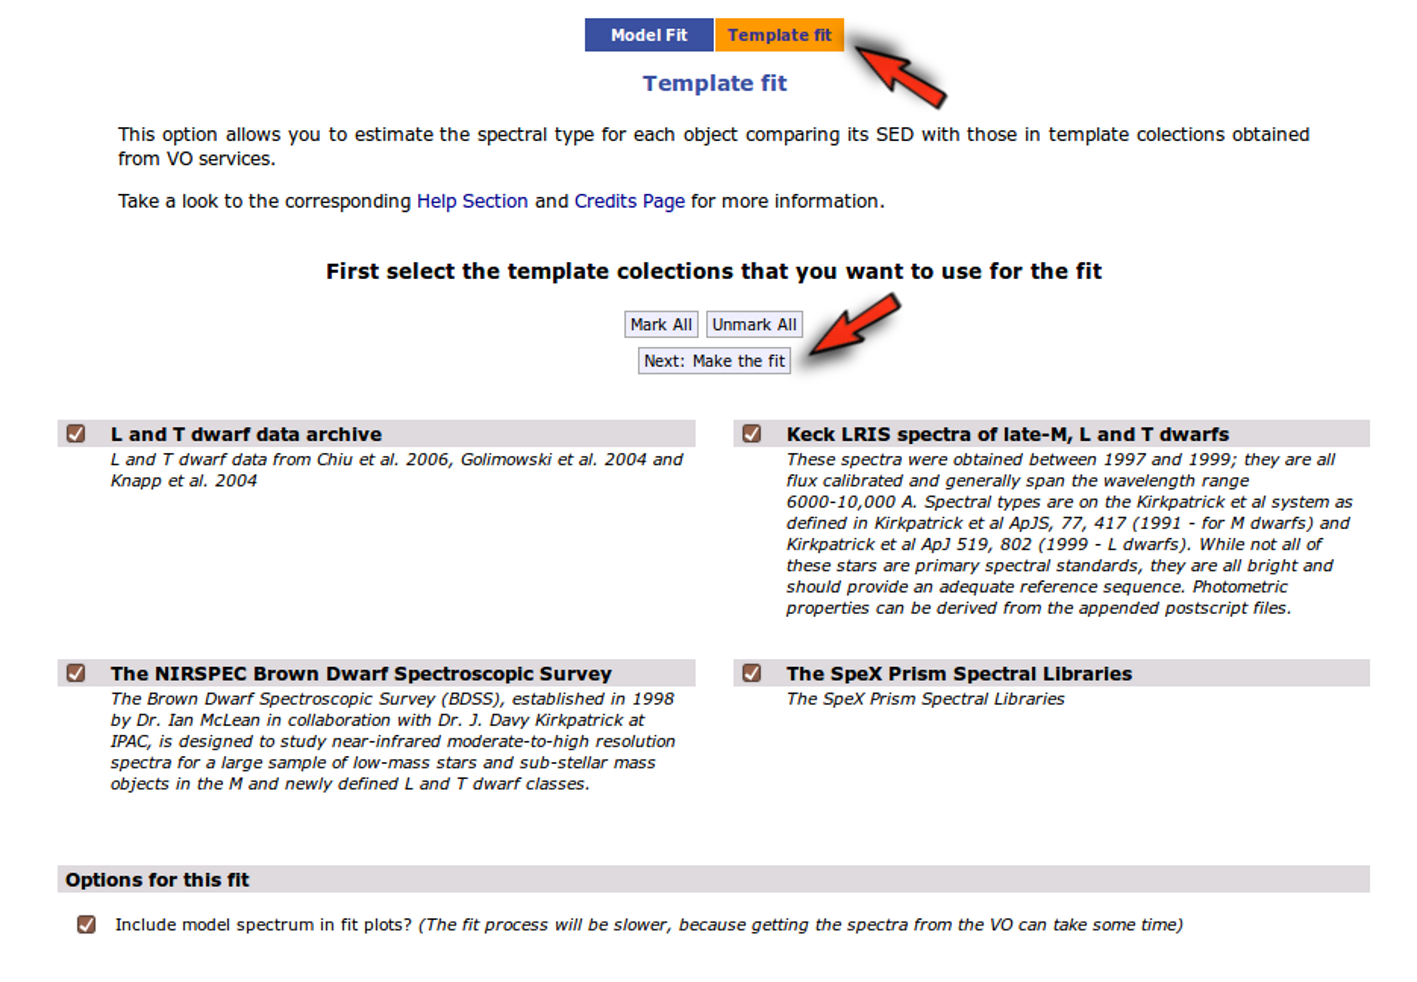
We enter the Chi-2 Fit tab and then select the 'Template Fit' option. In this case we select all template collections and mark the 'include spectrum in plots' option to get nicer plots (the template spectra are not as big as theoretical spectra usually are, so using this option doesn't make the fit process much slower).
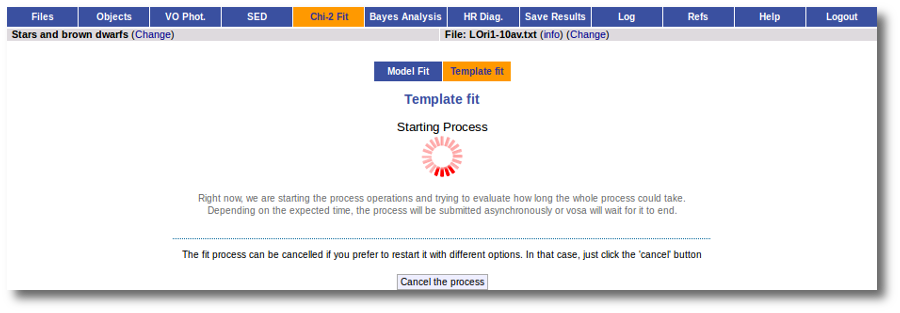
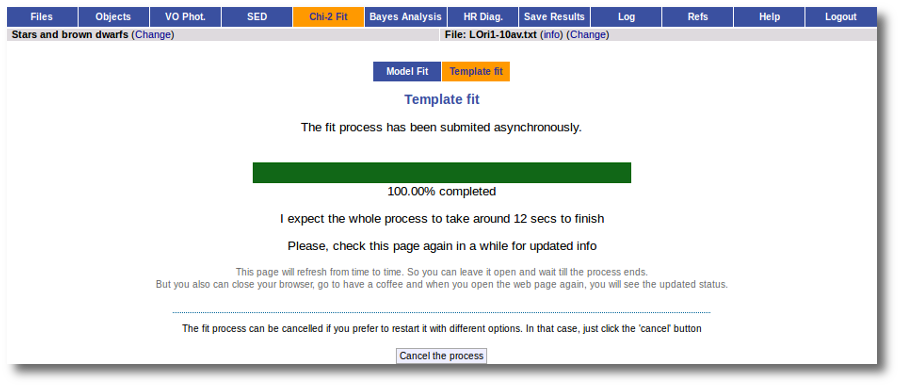
The fit process is performed asynchronously so that you don't need to stay in front of the computer waiting for th results. You can close your browser and come back later. If the fit is not finished, VOSA will give you some estimation of the status of the operation and the remaining time.
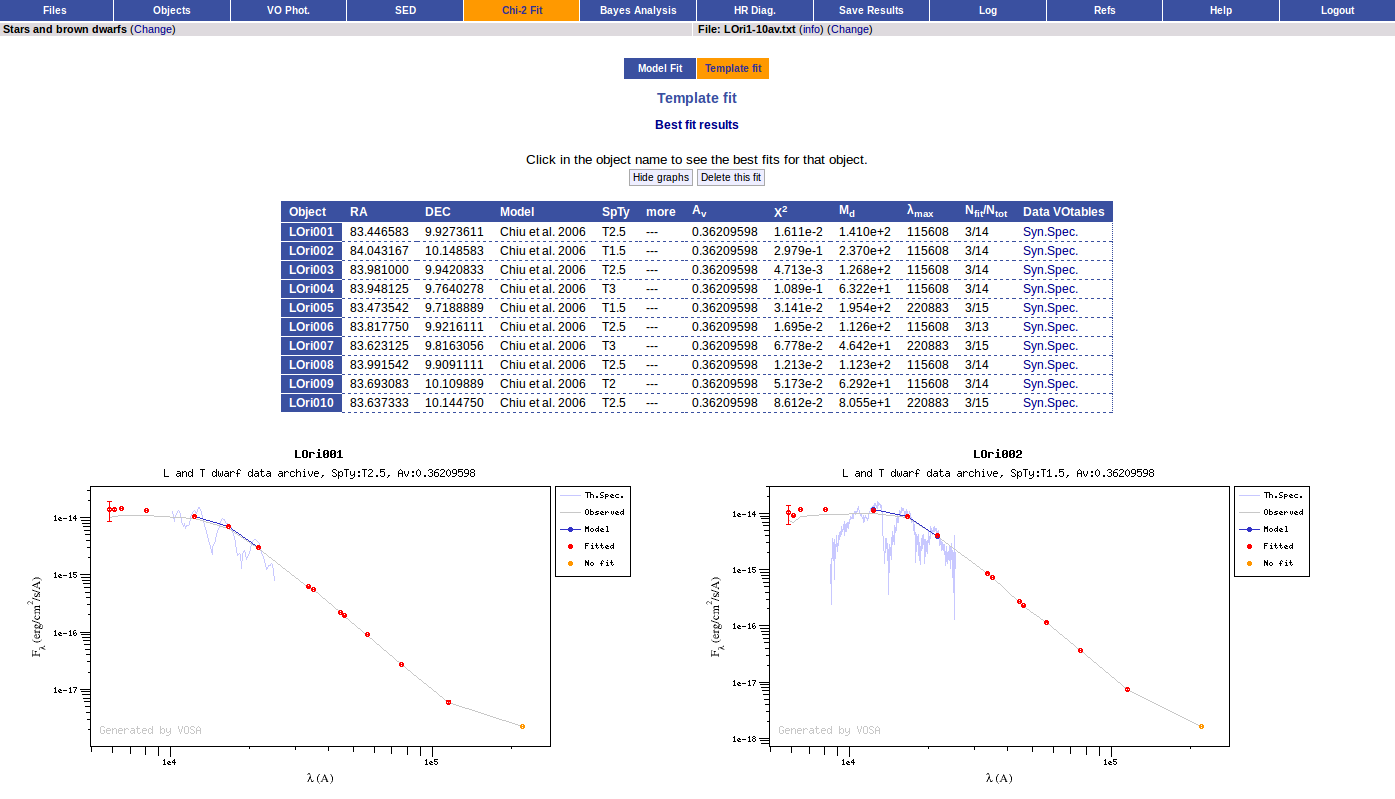
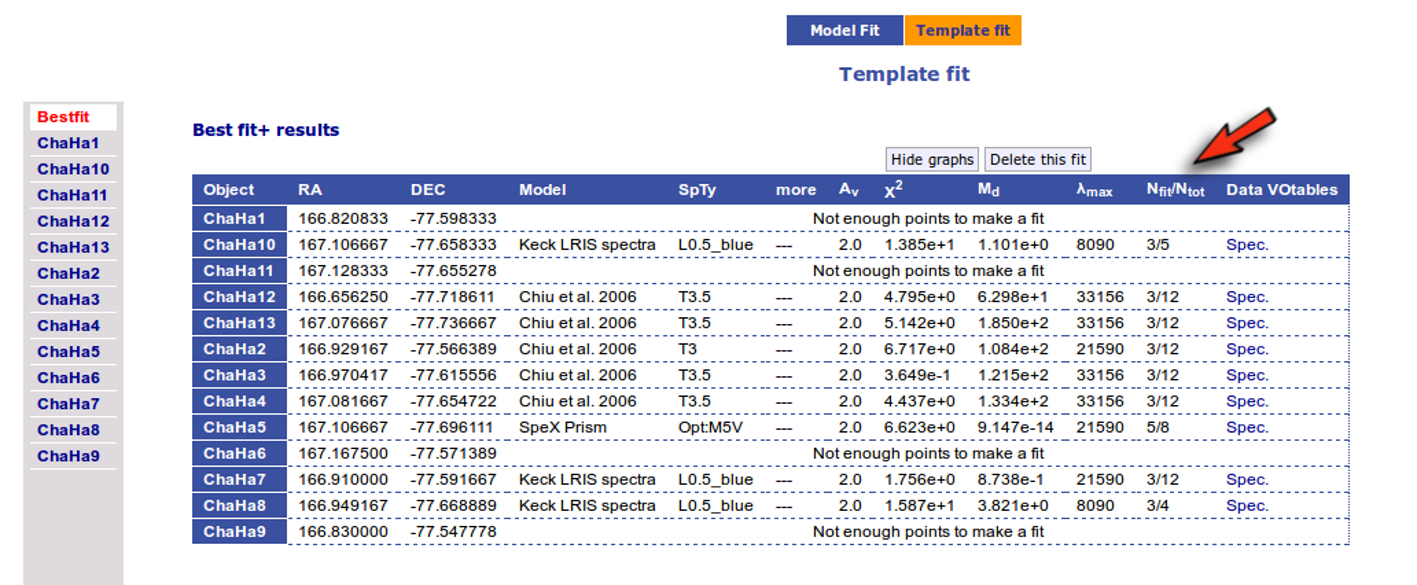
When the process finishes you can see a best fit results table with the spectral type that best fits the observed SED and, optionally, the corresponding plots.
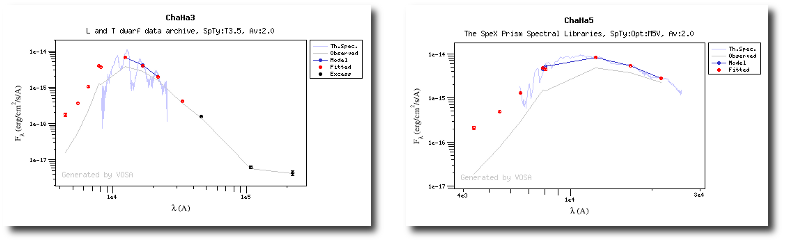
In the plots you can see that only a few points in the SED are used for the fit (only 3 points for the Chiu et al. collection).
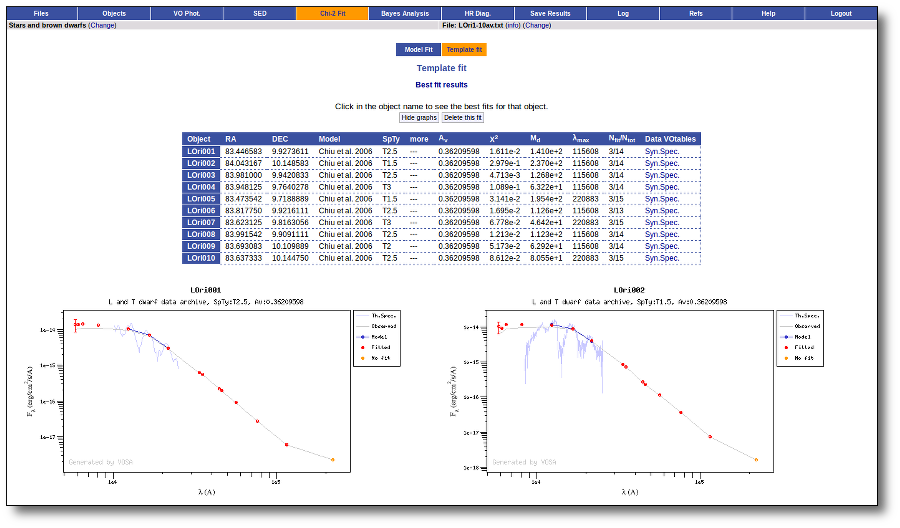 
If you click in one of the object names you can see the best 5 fits for each collection. If you click in the "See" link you can see the corresponding plot. As you see, for the Spex Prism collection, we are able to fit 4 points (instead of the 3 ones that are fitted with the Chiu et al. one).
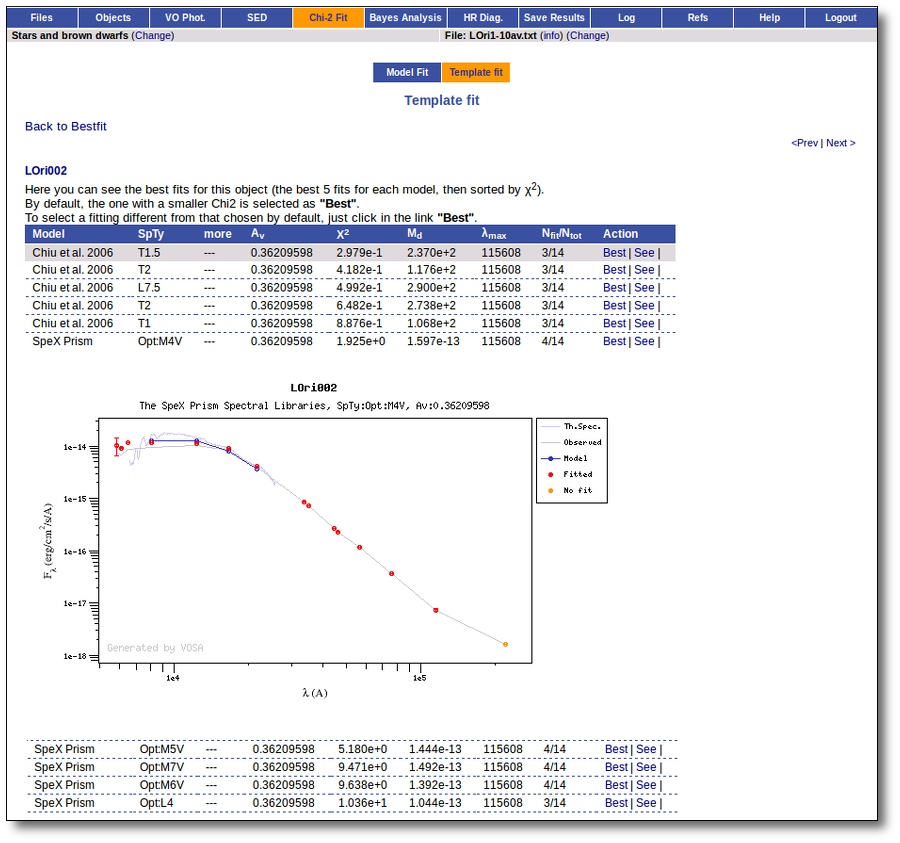
You have the option of choosing one of these fits as the best one if you wish, just clicking in the "Best" link on its right.
We see that only a few of the points in the SED are used for the fit. And in some cases there are not enough points.
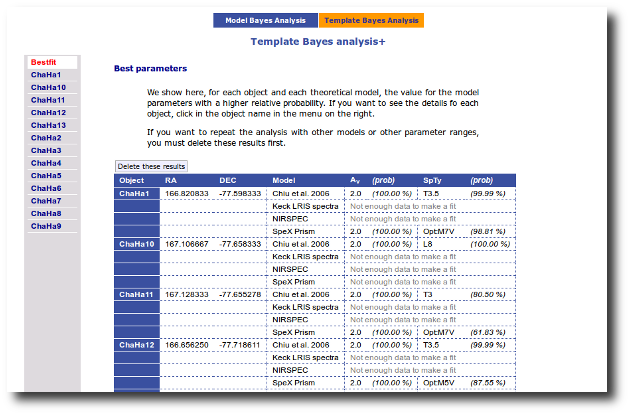
Bayes analysis
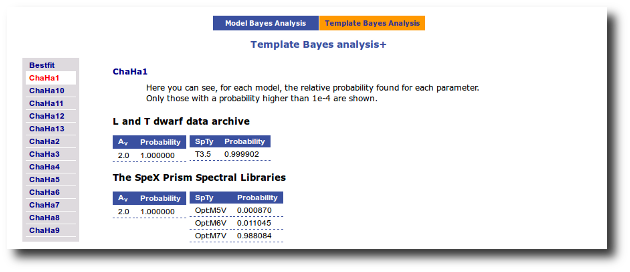
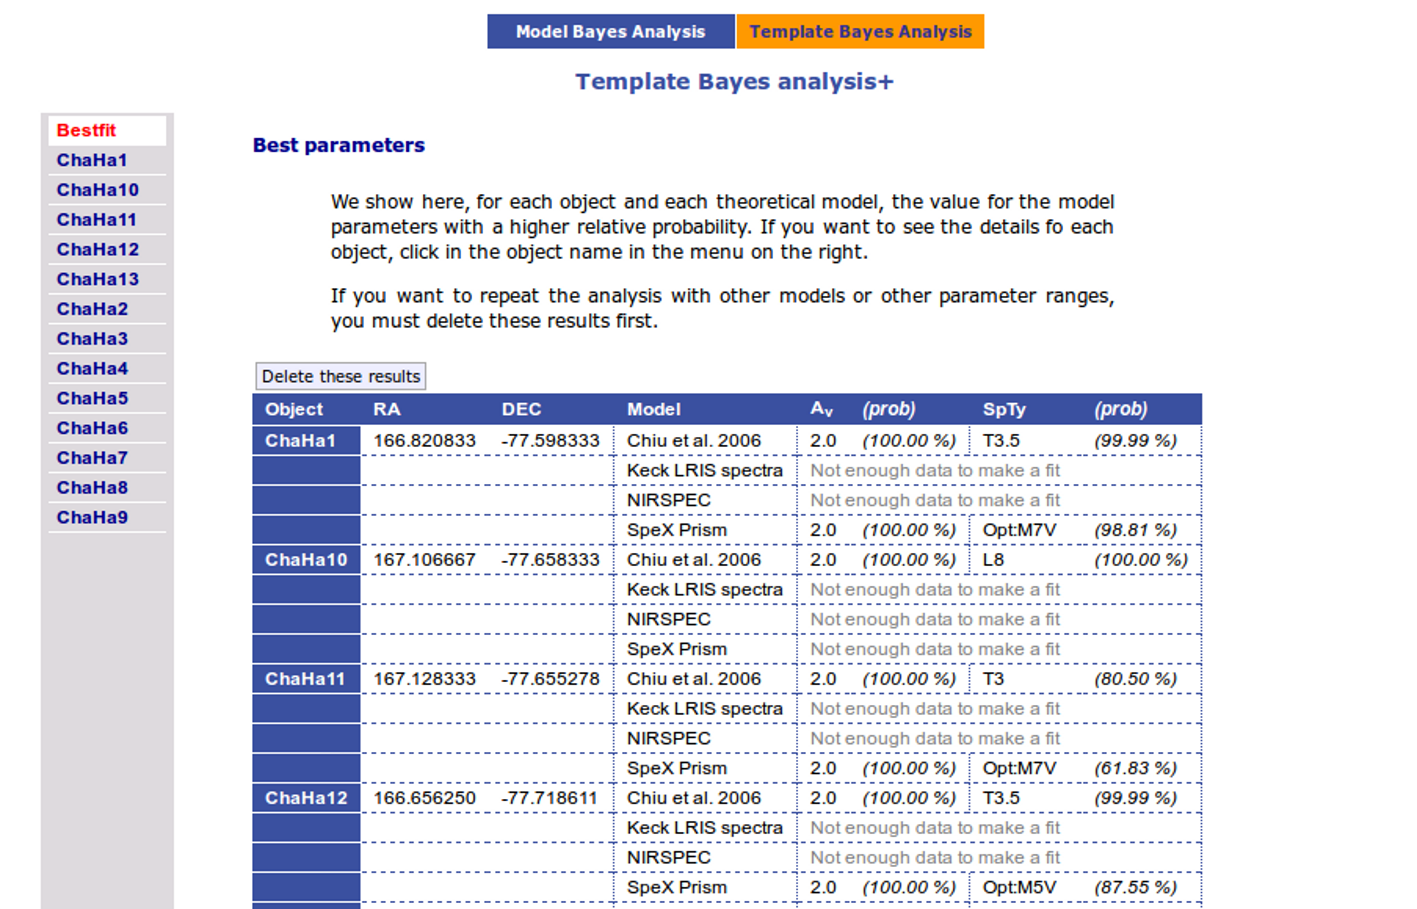
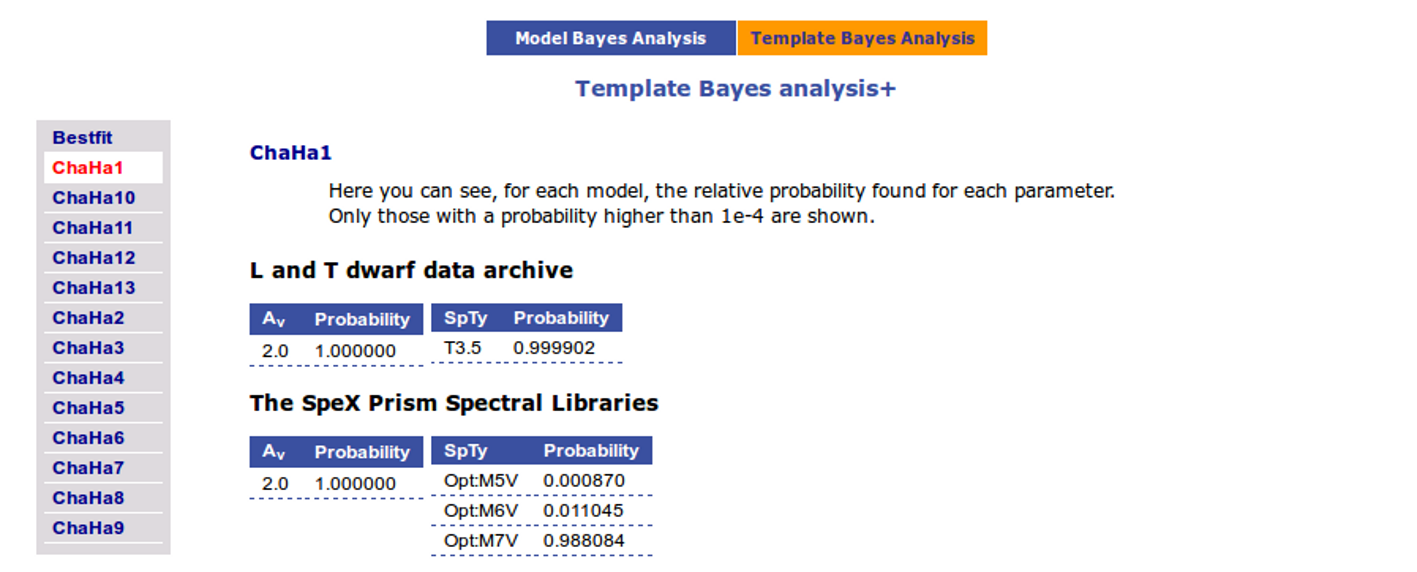
We can also make the bayes analysis using templates to get an estimation of the probability for each spectral type. Note that the probability for the AV value will always be 100% (because it's not actually fitted).
| 

 Bayes analysis