To assess the performance of VOSA to estimate effective temperatures of FGK stars, we have made use of the Elodie library (v3.1) (1389 objects).
First, we kept only entries in Elodie having a quality flag=4 ("excellent") in effective temperatures (159 objects)
Then, we cross-matched with the Gaia EDR3 catalogue looking for counterparts in 5arcsec. In order to avoid extinction - effective temperature degeneracies, we kept objects with parallaxes > 10 mas and relative errors < 20% (parallax_error/parallax < 0.2). After this, we kept 127 objects.
The observational SED of these objects were built gathering photometry from the following catalogues: SLOAN DR12, APASS9, Gaia EDR3, Pan-Starrs DR2, and 2MASS. Also the following grid of models were used: Kurucz ODFNEW/NOVER, alpha:0.0; Kurucz ODFNEW/NOVER, alpha0.4; BT-Settl, BT-Settl (CIFITS). Only objects with good SED fitting (vgfb < 12) were considered for the comparion.
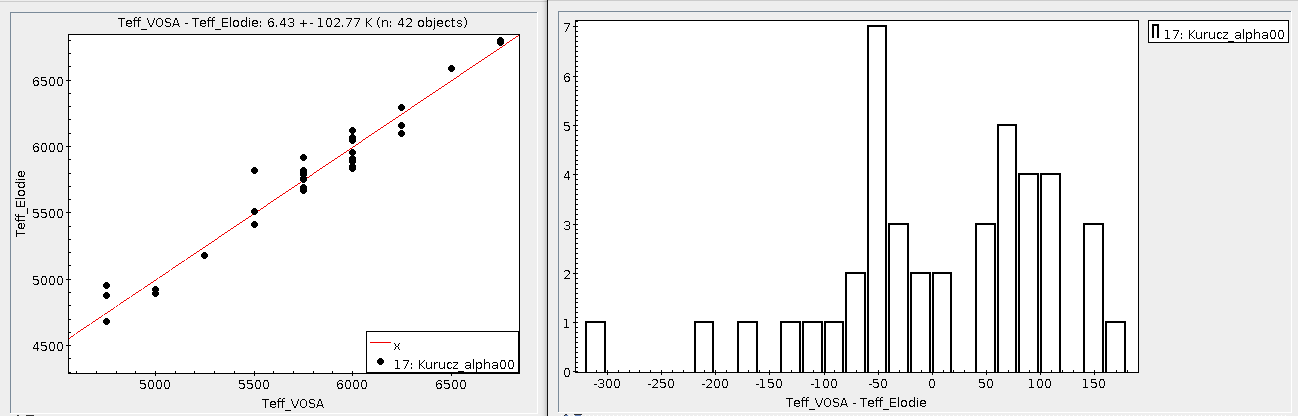
Kurucz model, alpha: 0.0.
Teff_VOSA - Teff_Elodie: 6.43 ± 102.77 K (42 objects)
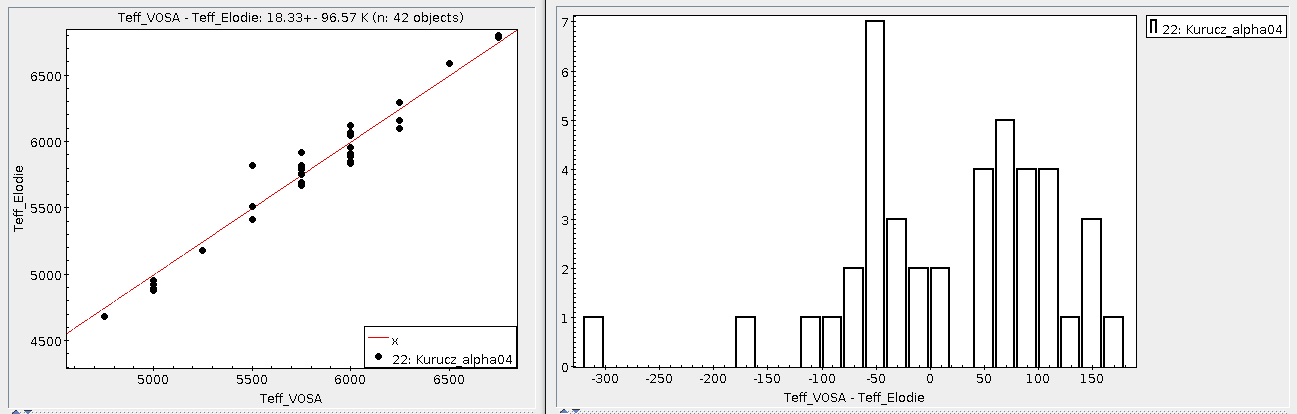
Kurucz model, alpha: 0.4.
Teff_VOSA - Teff_Elodie: 18.33 ± 96.57 K (42 objects)
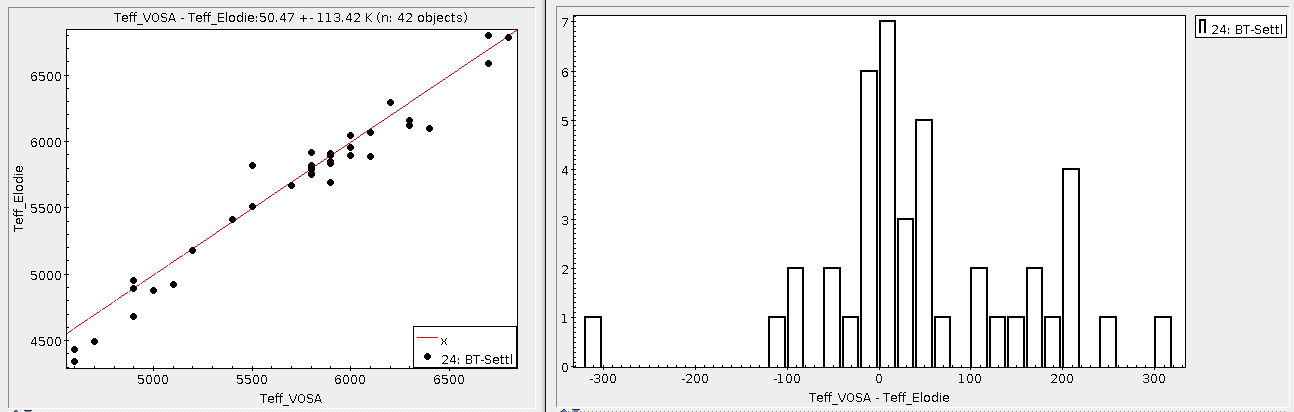
BT-Settl.
Teff_VOSA - Teff_Elodie: 50.47 ± 113.42 K (42 objects)
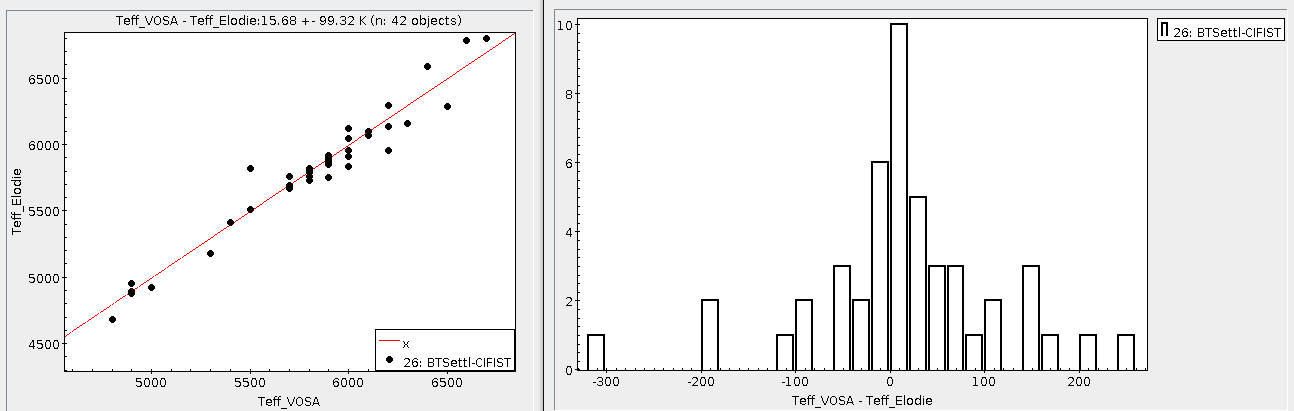
BT-Settl-CIFIST.
Teff_VOSA - Teff_Elodie: 15.68 ± 99.32 K (42 objects)
We can see how, for the four collections of models, VOSA estimates effective temperatures close to those given in Elodie. Only to mention that temperatures estimated using BT-Settl are slightly lower, in particular at Teff < 5200K.
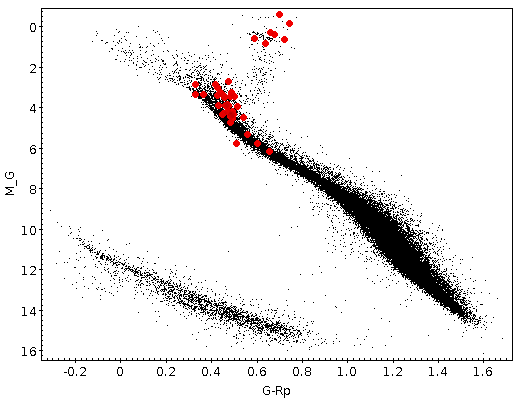
The position in the H-R diagram of the 42 objects used in the comparison is given below.
The forty-two objects used in the comparison are the following:
Object
RA (deg)
DEC (deg)
HD000693
2.81607
-15.46798
HD004307
11.36953
-12.88081
HD005015
13.26748
61.12397
HD009562
23.42848
-7.02534
HD017674
42.76785
30.28674
HD019476
47.37405
44.85754
HD029310
69.38328
15.14645
HD039587
88.59576
20.27617
HD043947
94.91739
16.01325
HD055575
108.95891
47.23996
HD059984
113.02401
-8.88133
HD061606
114.9972
-3.59751
HD064606
118.64241
-1.41225
HD073108
130.0534
64.32794
HD081809
141.94492
-6.07119
HD085503
148.1909
26.00695
HD089010
154.13454
23.5031
HD102224
176.51256
47.77941
HD104979
181.30225
8.73299
HD105755
182.56615
54.48815
HD107213
184.87302
28.15692
HD108954
187.7089
53.07661
HD128167
218.67007
29.74513
HD130322
221.88635
-0.28148
HD134083
226.82529
24.86919
HD134169
227.07524
3.93059
HD139798
234.5676
46.79775
HD141004
236.61089
7.35307
HD150177
249.91304
-9.55459
HD150997
250.72401
38.92225
HD159222
263.00415
34.27115
HD165401
271.40607
4.65717
HD165908
271.7564
30.56214
HD168009
273.88528
45.20932
HD186408
295.45398
50.52506
HD187123
296.74213
34.41952
HD188510
298.79034
10.74094
HD195633
308.09995
6.51757
HD199960
315.141
-4.73026
HD217014
344.36658
20.76883
HD219623
349.17627
53.21347
HD220954
351.99207
6.37899
VOSA and hot stars.
To assess the performance of VOSA at high temperatures we have used the compilation of sdO stars made by Stroeer et al. (2007 A&A, 462, 269)
For our analysis we have selected only those sdO targets not flagged as "outliers" in effective temperature (Table1 of the paper). Then, for these targets, the observational SED has been built using photometry (GALEX, CMC-14, 2MASS) retrieved from VO services using VOSA. The following criteria were adopted:
J(2MASS) < 17
H(2MASS) < 16.2
K(2MASS)< 15
r (CMC-14) < 17
FUV (GALEX) > 12
NUV(GALEX)>11
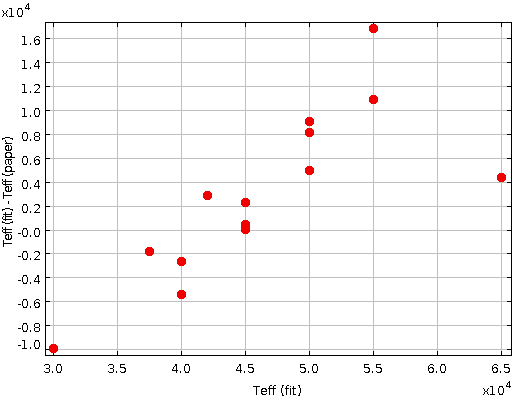
An average value of Teff (VOSA)-Teff (Stroeer)=2800 ± 6700K is found for a sample of 14 objects.
Photometric SED built using Galex, Gaia, APASS, 2MASS and WISE data.
Model fit using Kurucz (logg: 2.5 - 5.0; [M/H]:1-5-0.5)
Effective temperatures
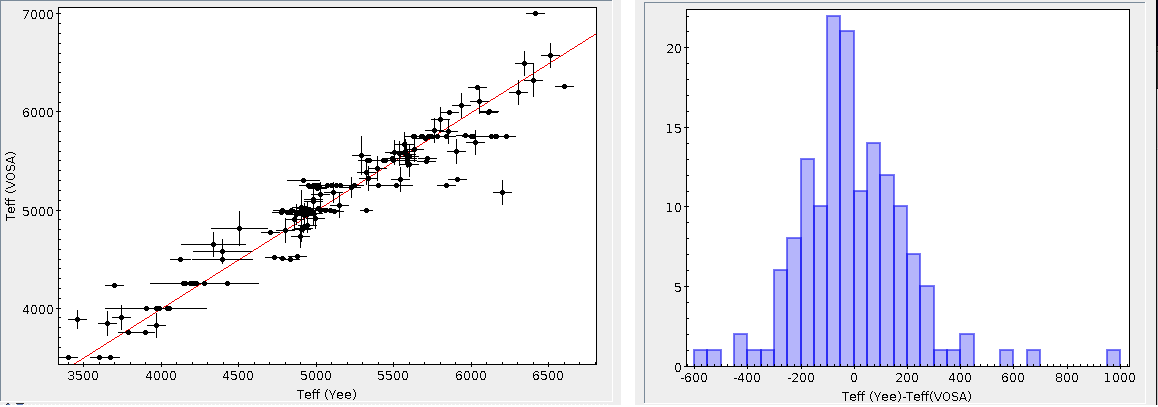
Only objects with good fit (vgfb<=12) and sigma<200K in the Bayesian fitting are considered (155 objects).
Using Kurucz model we find:
Teff (Yee) - Teff(VOSA)
Mean: -4.91K
Std: 208.84K
Median: -34.77K
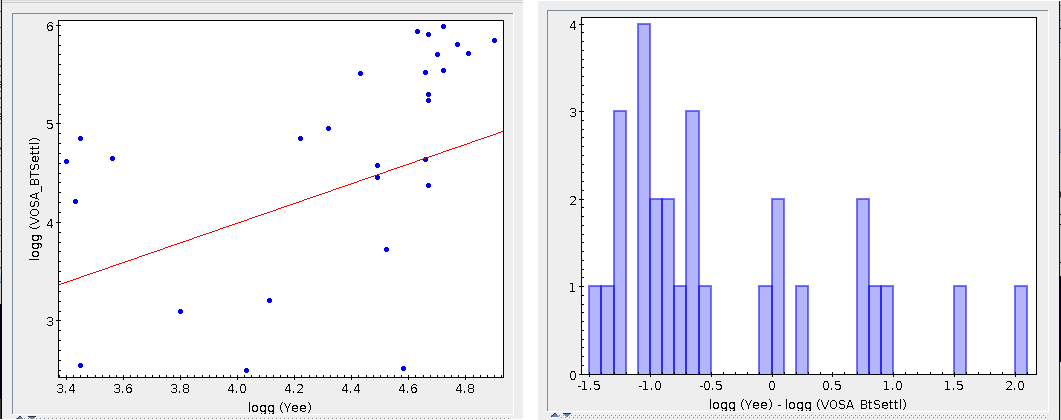
Surface gravities
Only objects with good fit (vgfb<=12) and sigma<0.3dex in the Bayesian fitting are considered (38 objects).
Using Kurucz model we find:
logg (Yee) - logg (VOSA)
Mean: 1.14dex
Std: 0.64dex
Median: 1.24dex
But if we use BT-Settl instead of Kurucz, the situation is the reverse, with the gravity values computed by VOSA systematically higher than those given in the paper (28 objects have been used this time).
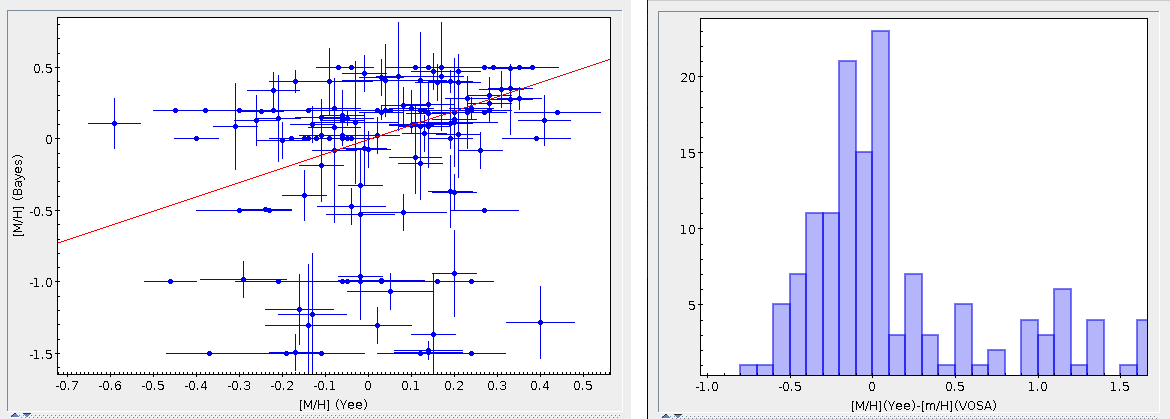
Metallicities
Only objects with good fit (vgfb<=12) and sigma<0.3dex in the Bayesian fitting are considered (141 objects).
Using Kurucz model we find:
[M/H] (Yee) - [M/H] (VOSA)
Mean: 0.16dex
Std: 0.58dex
Median: -0.02dex
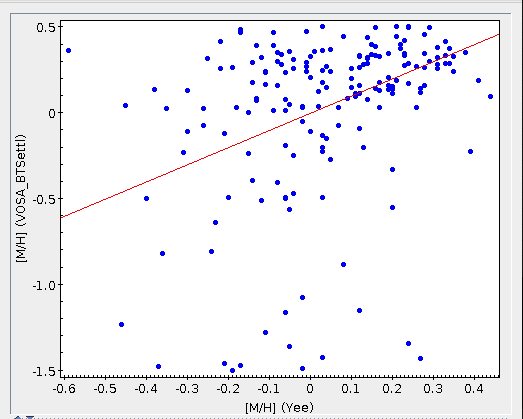
A similar result is obtained is BT-Settl is used:
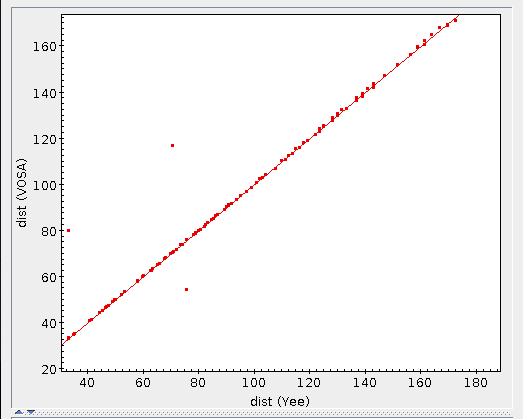
Radius
Only objects with good fit (vgfb<=12) and errors in Parallaxes (TGAS) < 10% (190 objects).
Excellent agreement between the distances used in the paper and those used in VOSA (from TGAS).
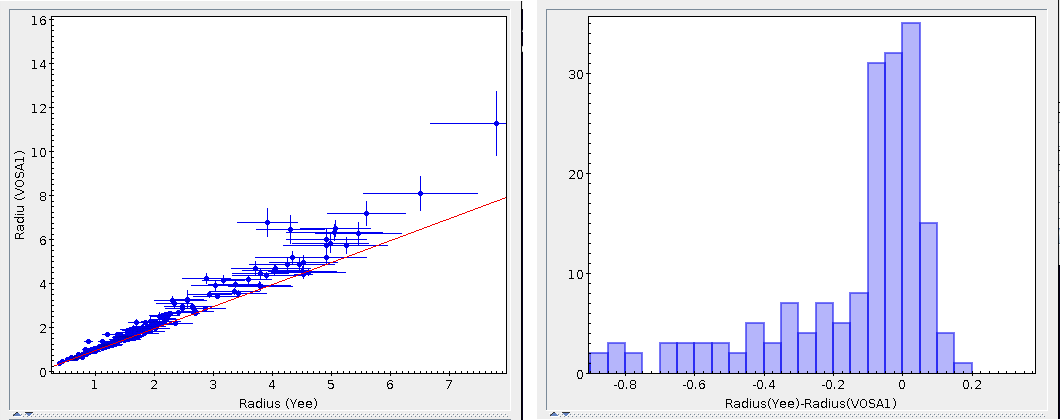
Radius1 (VOSA); defined by: Md = (R/D)^2
Using Kurucz model we find:
Radius1 (Yee) - Radius1 (VOSA)
Mean: -0.23 Rsun
Std: 0.47 Rsun
Median: -0.06 Rsun
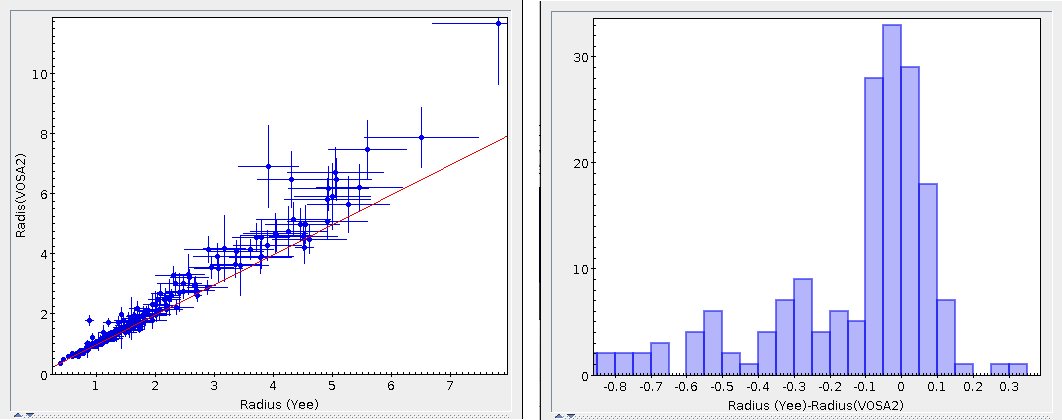
Radius2 (VOSA); defined by: Lbol = 4 * pi * R^2 * σ * Teff^4
Using Kurucz model we find:
Radius2 (Yee) - Radius2 (VOSA)
Mean: -0.24 Rsun
Std: 0.50 Rsun
Median: -0.06 Rsun
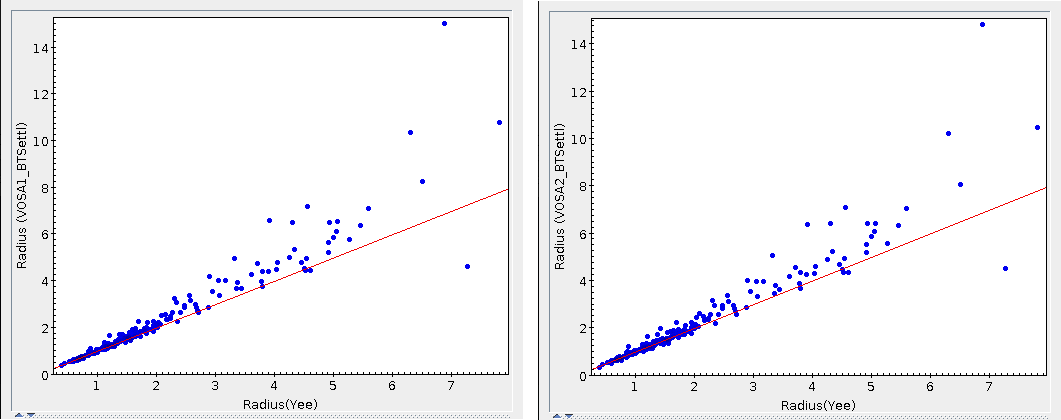
Similar plots are obtained if BT-Settl models are used instead.
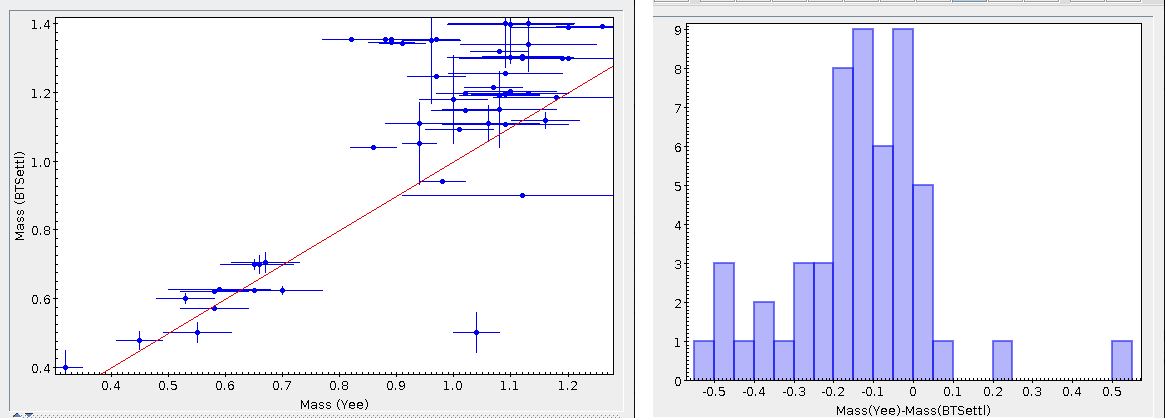
Masses
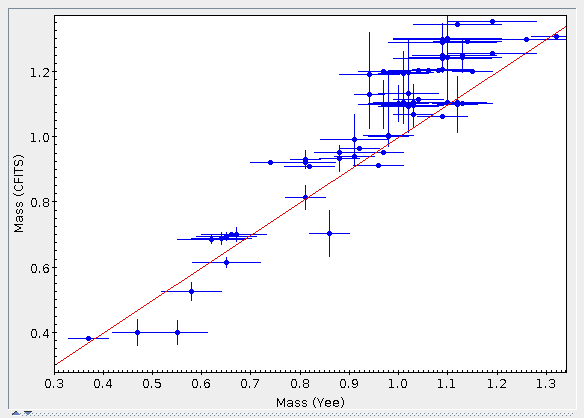
Only objects with good fit (vgfb<=12). 54 objects (restricted to masses below 1.4 Msun)
BTSettl isochrones and tracks.
Excellent agreement for subsolar masses. Masses over 1Msun are overestimated in VOSA-BTSettl.
Mass(Yee) - Mass (VOSA_BTSettl)
Mean: -0.11Msun
Std: 0.09Msun
Median: -0.13Msun
Similar results are obtained if the BTSettl-CFITS isochrones and tracks are used:
We compare the results in Lindgren & Heiter 2017 (here-after LH17) with the fit results obtained with VOSA.
Effective temperatures
Efective temperatures computed by VOSA are in agreement with those
given in LH17. On average, LH17 temperatures are systematically
higher by less than 100K both for BT-Settl and CIFITS. Standard
deviations are below 150 K in both cases.
Below 3400 K, LH17 effective temperatures are larger (250 K and 450 K)
than those provided by BT-Settl. This trend does not appear if CIFITS
models are used. Anyway, a larger number of objects would be neces-
sary to confirm this result.
Surface gravities, metallicities
As expected from the minor contribution of these parameters to the
SED shape, the values obtained from VOSA are affected by large uncertainties and, thus, are not reliable.
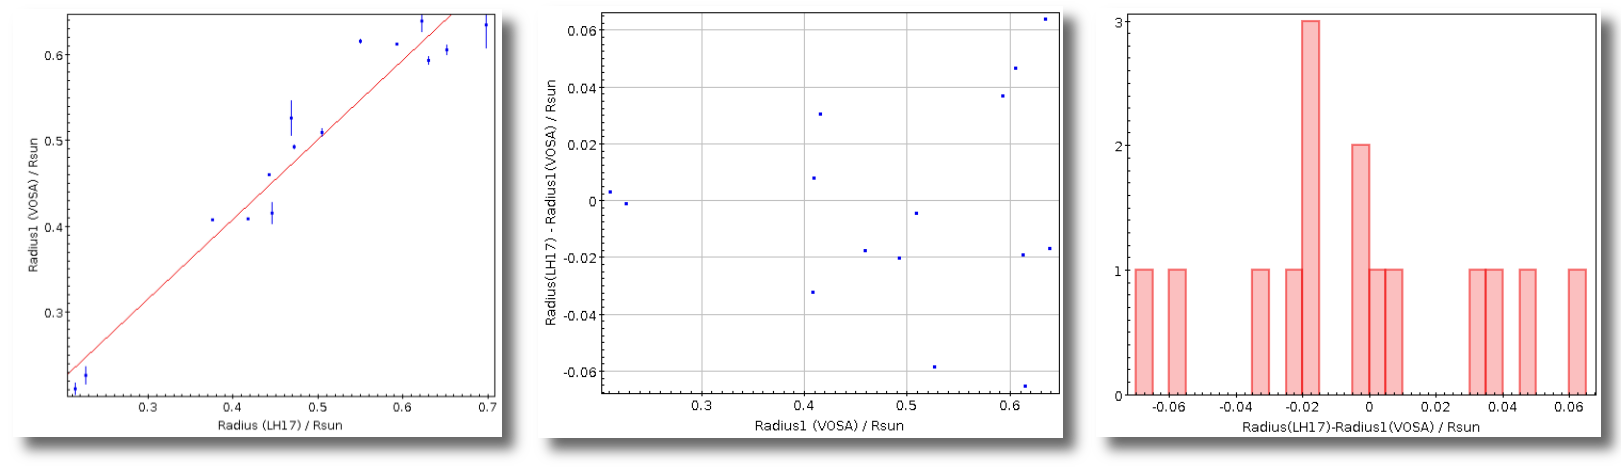
Stellar radii
There are not significant differences between the radii derived using BT-Settl or BT-Settl CIFIST models and both are in very good agreement
with the values derived by LH17.
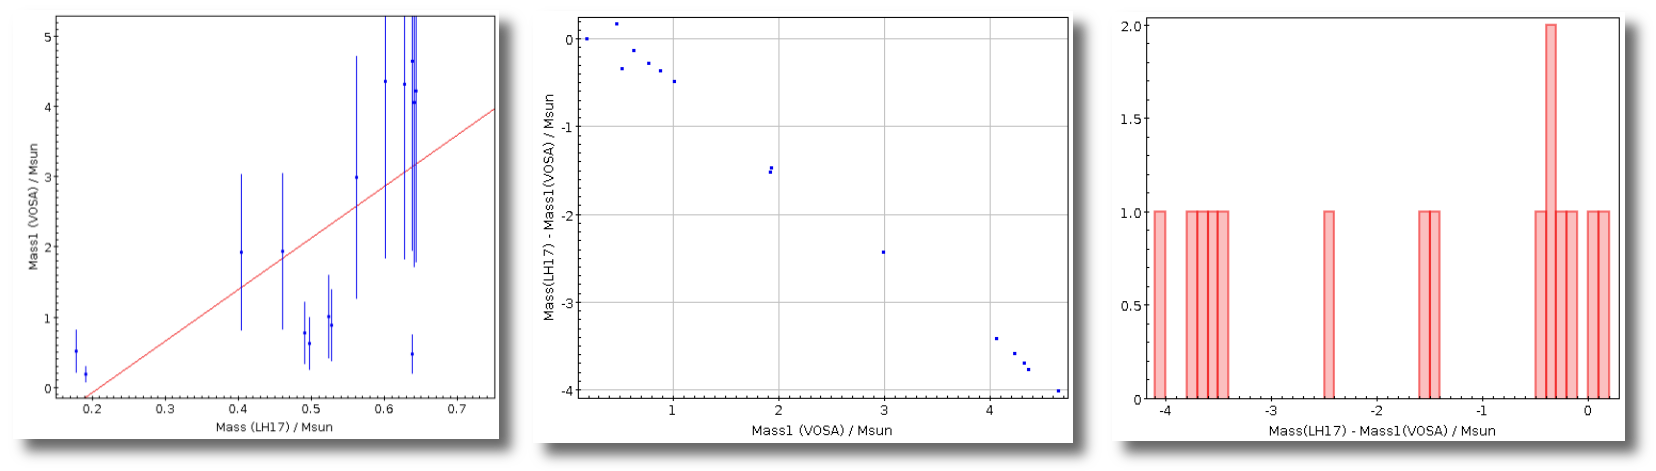
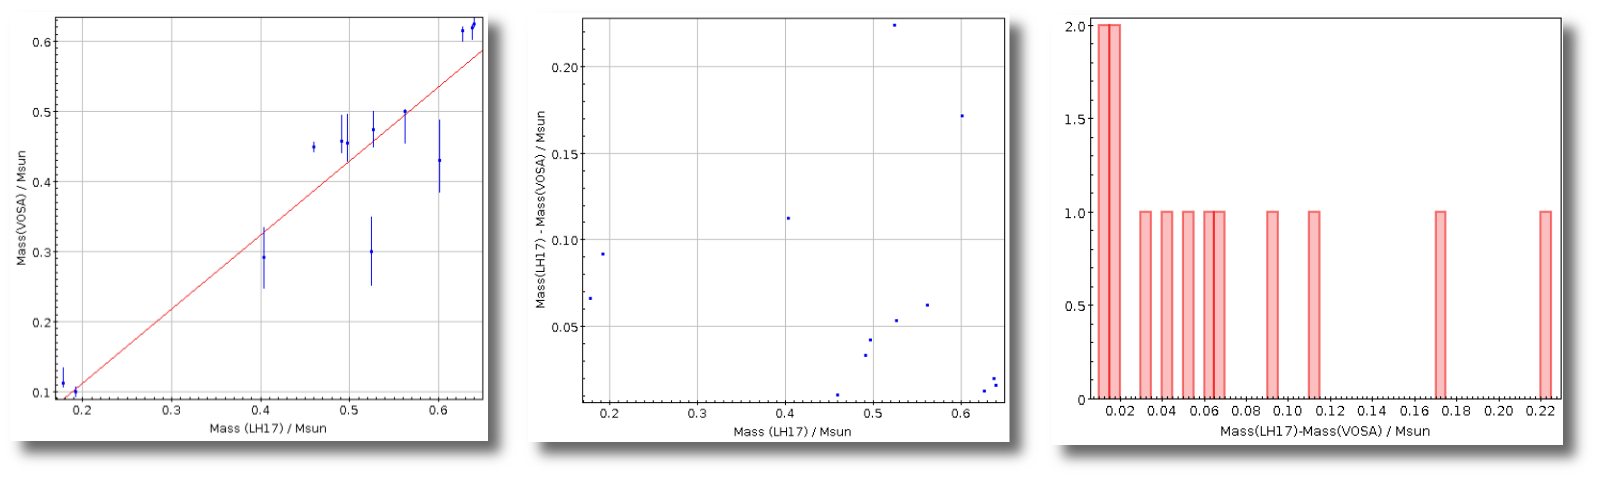
Stellar masses
While masses directly derived from M = gR 2 /G are not reliable due
to the large uncertainties associated to the surface gravities estimated
with VOSA, those obtained using the BT-Settl and BHAC isochrones
are in reasonable agreement with the ones obtained in LH17. The
agreement is slightly worse if the BHAC isochrones are used.
Sample and input parameters
Lindgren & Heiter 2017.
Parameter determination for sixteen cool dwarfs using high-resolution
spectra taken with CRIRES at VLT:
J band (1100-1400 nm)
R = 50 000
SNR: 55-205
Stellar properties:
Temperatures determined from FeH lines for M dwarfs cooler
than 3575 K, and from photometric calibration for warmer
stars. 3350 < Teff[K] < 4550 (±100 K)
Photometric SED built using photometry from GALEX, Johnson,
SDSS, TYCHO, APASS, GAIA, DENIS, 2MASS, WISE, AKARI
and IRAS, retrieved from VO services.
Model fit using BT-Settl (log g : 4-6; [M/H]: -0.5-0.5, Teff: 3000 - 5500 K)
Model fit using BT-Settl CIFIST (log g : 4 - 6; [M/H] = 0,
Teff: 3000 - 5500 K)
Parameters determination
For comparison and to assess whether the parameters obtained with VOSA
are model-dependent, we performed this analysis using two models: BT-Settl
and BT-Settl CIFIST. One of the sixteen stars has not enough photometric
data. Thus, this analysis was carried out for the fifteen remaining stars.
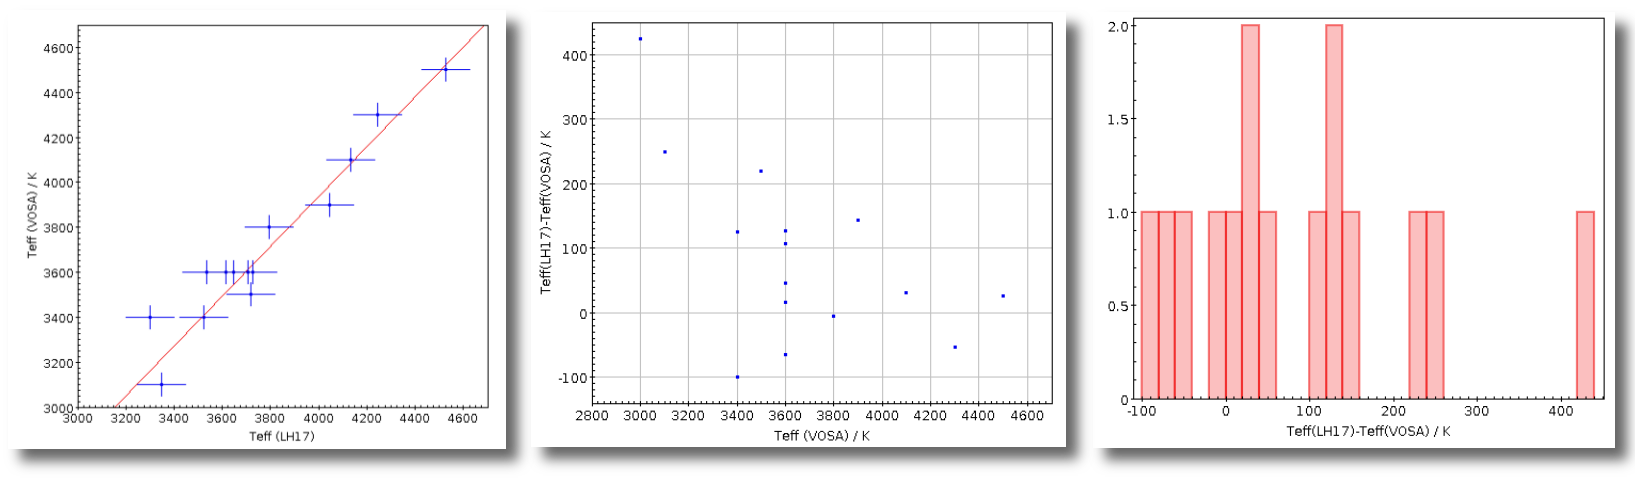
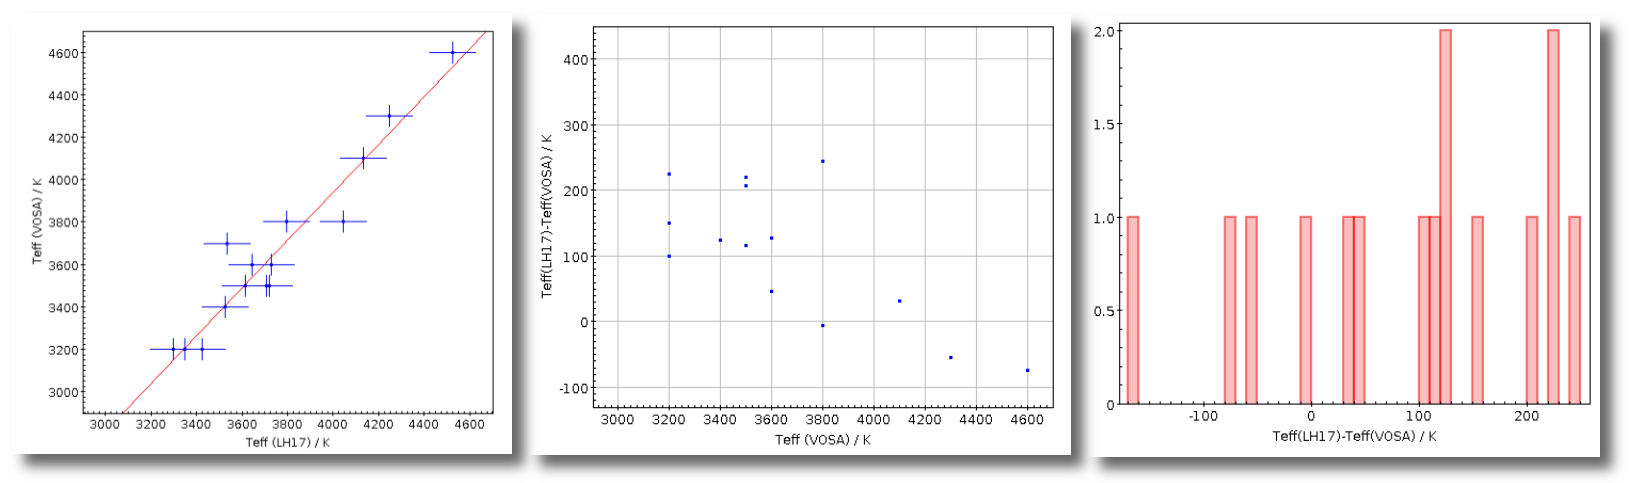
Mean(Teff(LH17) - Teff(VOSA)) = 86.3 K; std = 117.2 K
Both models give consistent values for the effective temperature.
Figure 1: Effective temperatures using BT-Settl. Correlation coefficient r = 0.95. Figure 2: Effective temperatures using BT-Settl CIFIST. Correlation coefficient r = 0.96.
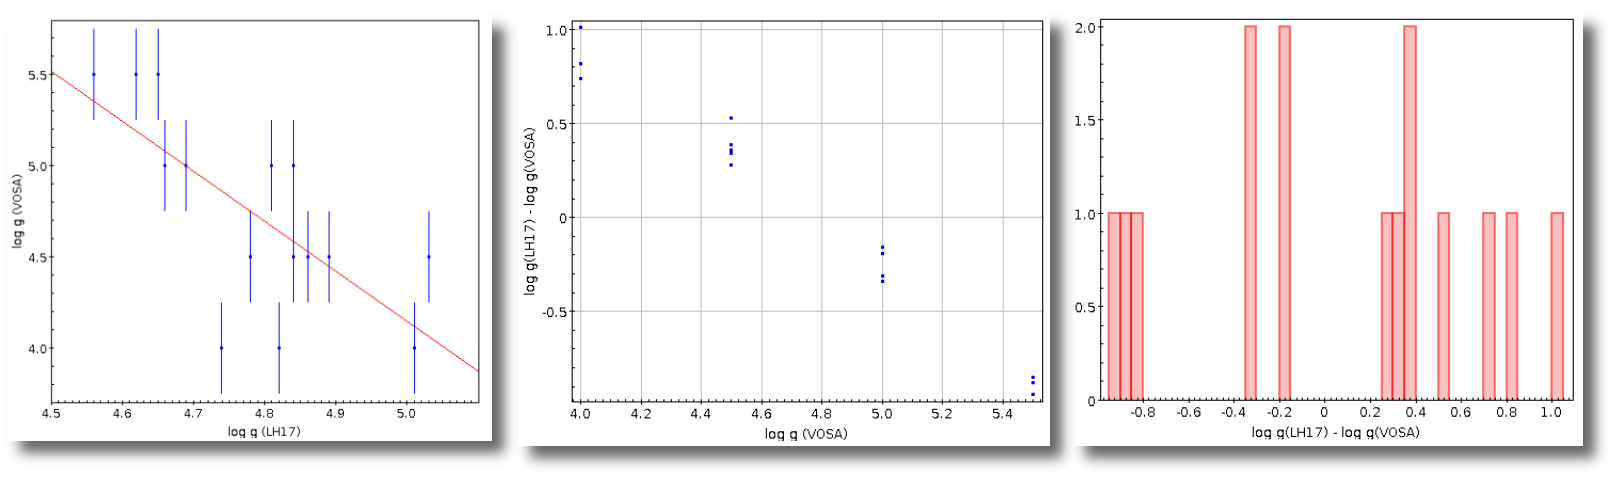
Surface gravities provided by VOSA are not consistent with the values
given in the paper. Using BT-Settl we obtain higher values for stars with the
lowest gravities in LH17 and lower values for the stars with highest gravities
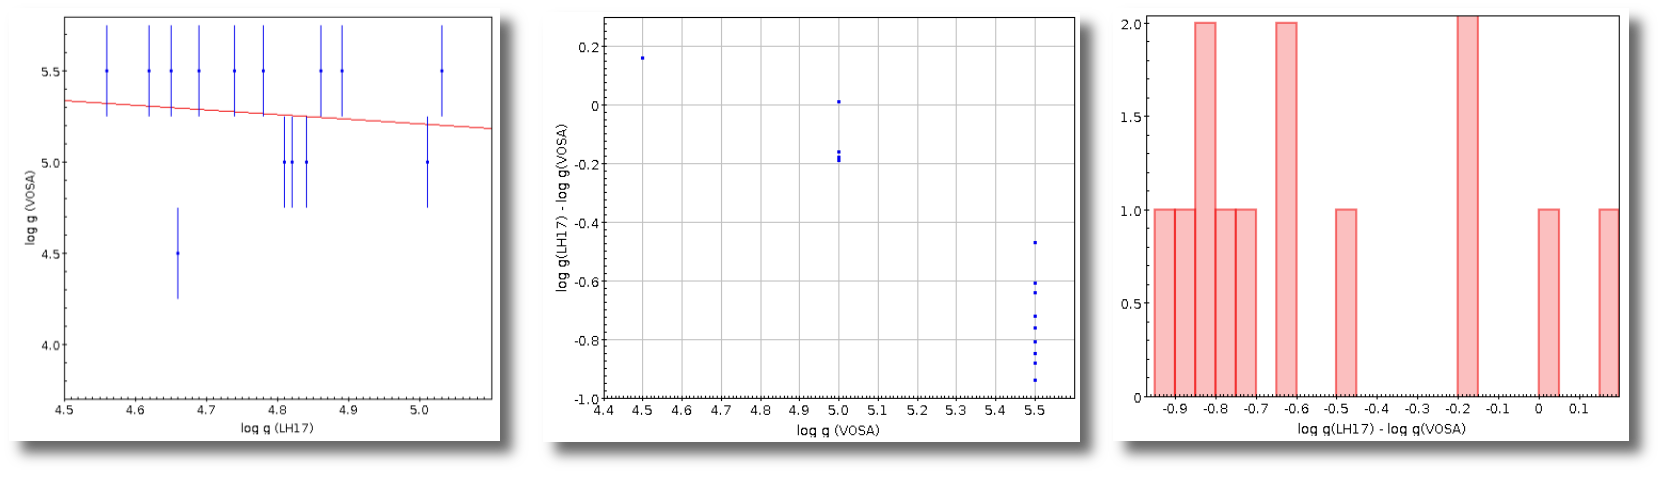
(see Fig. 4). On the other hand, this does not happen using BT-Settl CIFIST but we obtain significantly higher values.
Figure 4: Surface gravities using BT-Settl. Correlation coefficient r = -0.70. Figure 5: Surface gravities using BT-Settl CIFIST. Correlation coefficient r = -0.11.
Radii and masses
VOSA computes two stellar radii from two different equations:
$$ M_d = (R_1 /D)$$
$$ L_{\rm bol} = 4\pi R_2^2 \ \sigma \ T_{\rm eff}^4$$
where M d is the proportionality factor used to fit the model to the observations, D is the distance and $\sigma$ is the Stephan-Boltzmann constant.
From $R_1$ and $R_2$ , VOSA provides also stellar masses by applying:
$$ g = \frac{GM}{R^2}$$
Since the surface gravities provided by VOSA do not agree with those
given in the paper, we do not expect consistent masses either. In any case,
we performed for the masses the same analysis as for the radii and will derive
proper masses from the HR diagram.
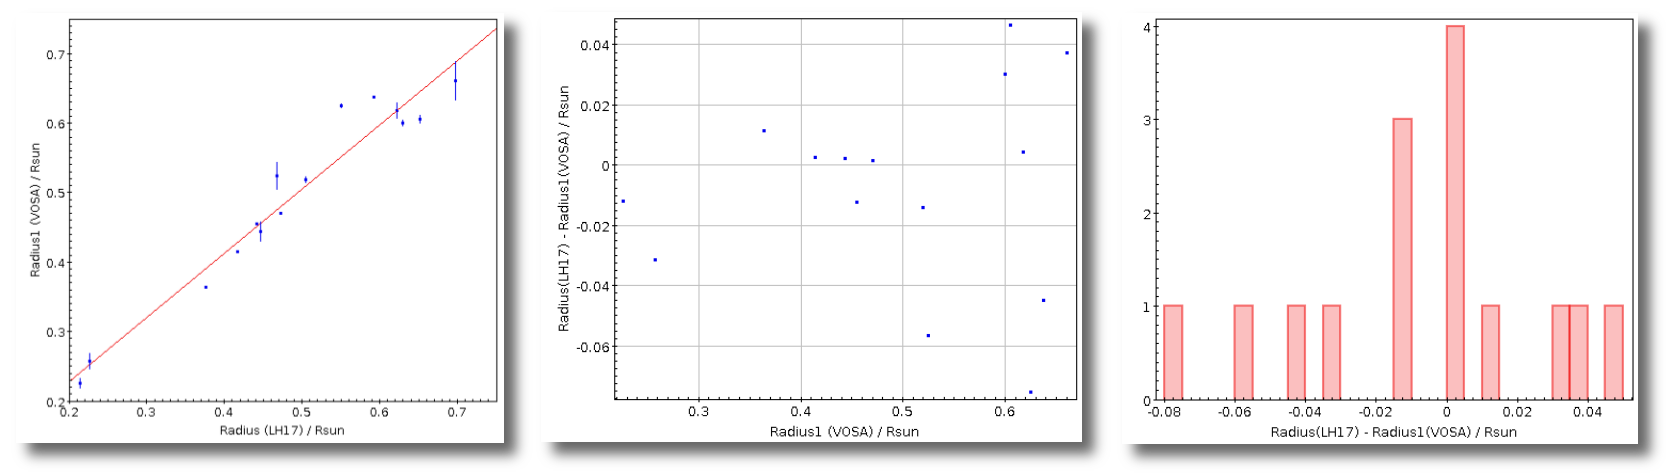
There are not significant differences between the radii derived using BT-
Settl or BT-Settl CIFIST models. Similar radii are obtained from Eqs. 1 and 2 and both are in very good agreement with the values derived by LH17.
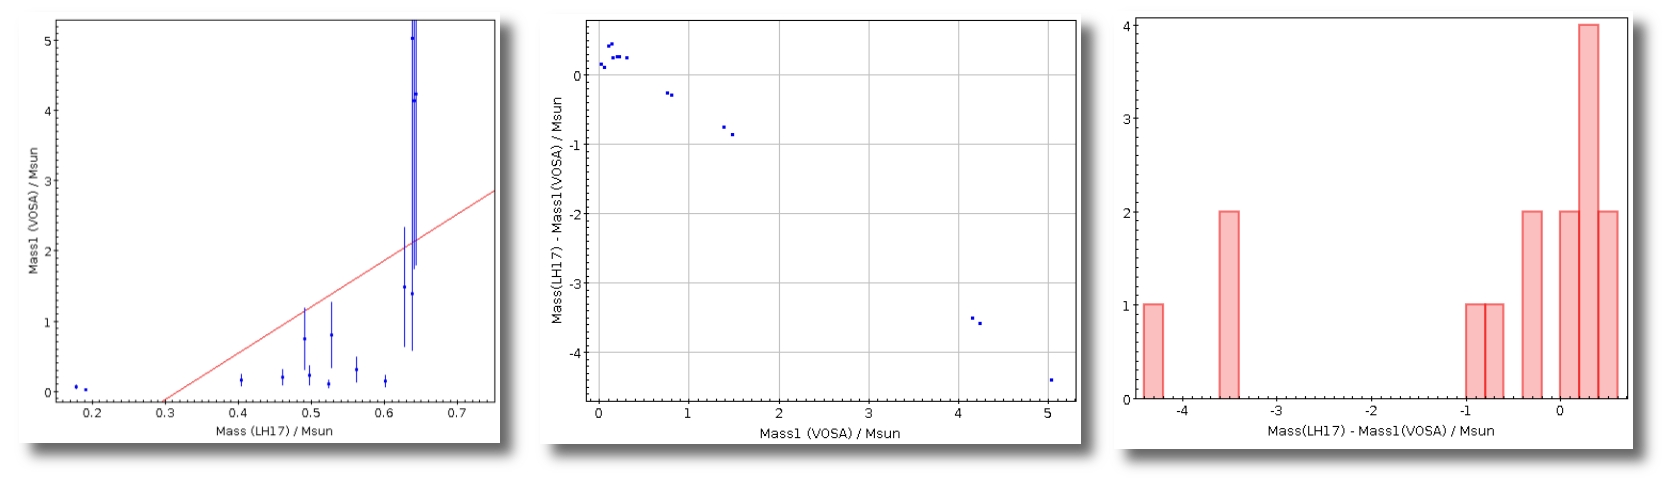
On the contrary, masses are not consistent with the masses expected
for cool dwarfs and, hence, do not agree with those given in the paper, as
expected from the log g values obtained with VOSA.
Figure 6: Radii using BT-Settl. Correlation coefficient r = 0.97. Similar plots are obtained for the radii derived from Eq. 2. Figure 7: Masses using BT-Settl. Correlation coefficient r = 0.58. Similar plots are obtained for the masses derived from the radii calculated using
Eq. 2. Figure 8: Radii using BT-Settl CIFIST. Correlation coefficient r = 0.97. Similar plots are obtained for the radii derived from Eq. 2. Figure 9: Masses using BT-Settl CIFIST. Correlation coefficient r = 0.65. Similar plots are obtained for the masses derived from the radii calculated using Eq. 2.
Two K dwarfs lie outside the area covered by the isochrone. With
a few exceptions, we found good agreement between values for the
thirteen remaining dwarfs.
We compare the effective temperatures and luminosities derived by Carlos Cifuentes San Román (Master thesis, Sept. 2017, Universidad Complutense de Madrid; hereafter CCSR), and the effective temperatures from Passeger et al. in prep. (hereafter Pass17) with the fit results obtained with VOSA.
Effective temperatures
VOSA provides effective temperatures using BT-Settl models in agreement with the estimated values of CCSR within 200 K. The comparison with the effective temperatures computed by Pass17 results in a higher dispersion. This differences are explained by the differences among CCSR's and Pass17's temperatures (the relation between them gives a correlation coefficient of r=0.88).
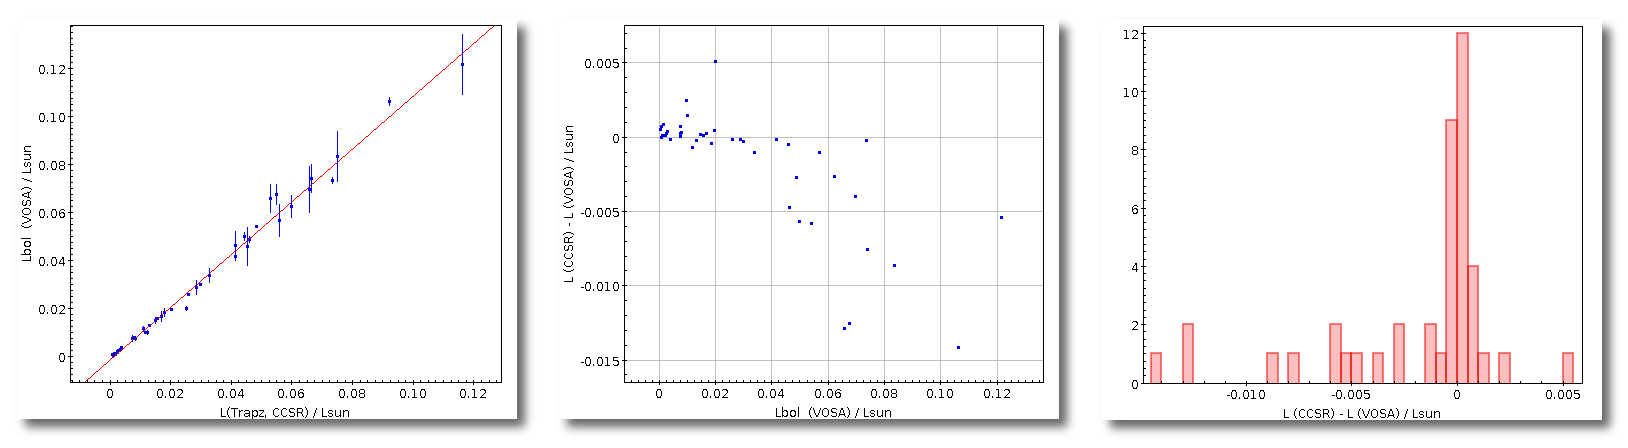
Luminosities
Excellent agreement between the bolometric luminosities provided by VOSA and CCSR's.
Sample and input parameters
CCSR
Effective temperatures estimation for 48 M dwarfs from their spectral types and low-resolution model spectra.
Luminosity determination for 48 M dwarfs given the magnitudes (u) B g V R r i J H K W1 W2 W3 W4 (u only used when available) performing numerical integration via Simpson's rule and Trapezoidal rule.
Up to 16 photometric passbands in the range 154 to 22088 nm.W.
Spectral types of the sample: M0 V -- M7.0 V.
2600 < Teff < 4100 K.
0.0007 < L < 0.1162 Lsun.
Pass17
Effective temperatures for 30 M dwarfs of the previous sample derived using high-resolution spectra taken with FEROS at the 2.2 m of the European Southern Observatory (La Silla, Chile), CAFE and CARMENES at the 2.2 m and 3.5 m telescopes in Calar Alto (Almería, Spain), and HRS at the 9.2 m HET (Texas).
230 < Teff < 4169 K.
SED building using VOSA
Photometric SED built using photometry from GALEX, Stromgren, Johnson, SDSS, TYCHO, APASS, Gaia, DENIS, 2MASS, UKIDSS, VISTA, WISE, MSX, IRC and IRAS retrieved from VO services.
Model fit using BT-Settl (log{g}: 4.0 - 6.0; [M/H]: -0.5 - 0.5, Teff: 2300 - 5200 K)
Parameters determination
Of the 48 stars in this study, five have not enough photometric points retrieved by VOSA for the fit.
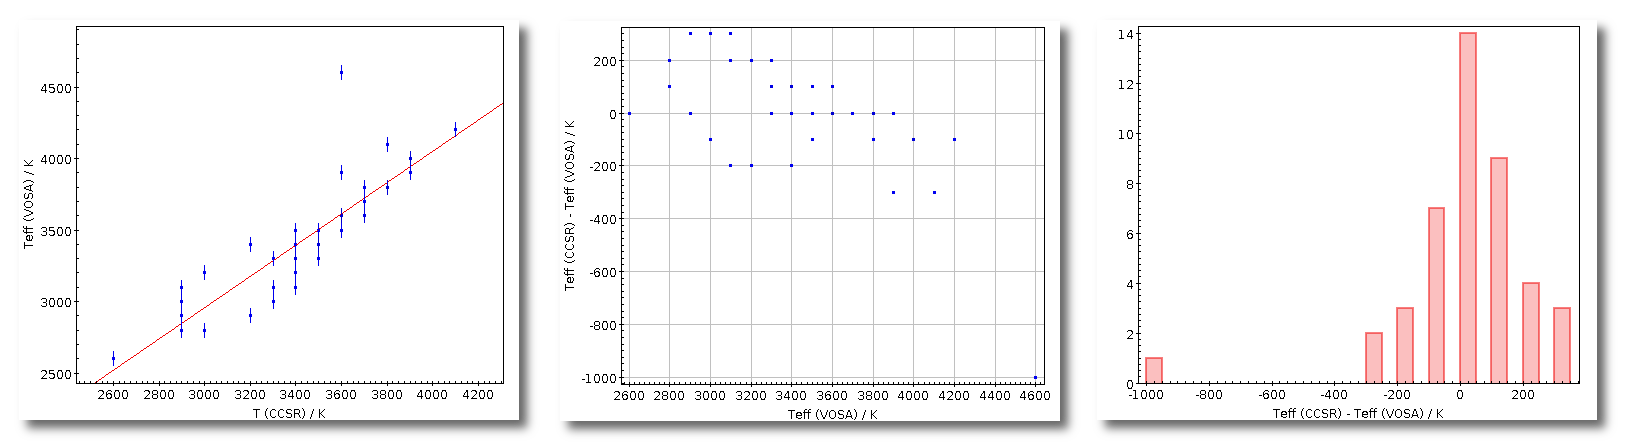
Effective temperatures
To give an idea of the temperatures used for the analysis, the difference between them has a mean value of 58 K and a standard deviation of 111 K.
Effective temperatures provided by VOSA are in agreement with those derived by CCSR with one exception which effective temperature is 1000 K higher than estimated by CCSR. Fig. 1.
Figure 1: Comparison of CCSR's effective temperatures. Correlation coefficient r=0.87 (r=0.93 excluding the one outlier).
In this case, the concordance between temperatures is slightly worse, but also consistent. On average, VOSA provides higher values. Fig. 2.
Figure 2: Comparison of Pass17's effective temperatures. Correlation coefficient r=0.67 (r=0.84 excluding the one outlier).
Luminosity
In CCSR, luminosities were derived from two different approaches: via Simpson's rule and Trapezoidal rule. The difference between them has a mean value of 0.00008 Lsun and, therefore, the comparison will be carried out using the luminosities obtained via Trapezoidal rule. The comparison with those obtained via Simpson's rule would be analogue.
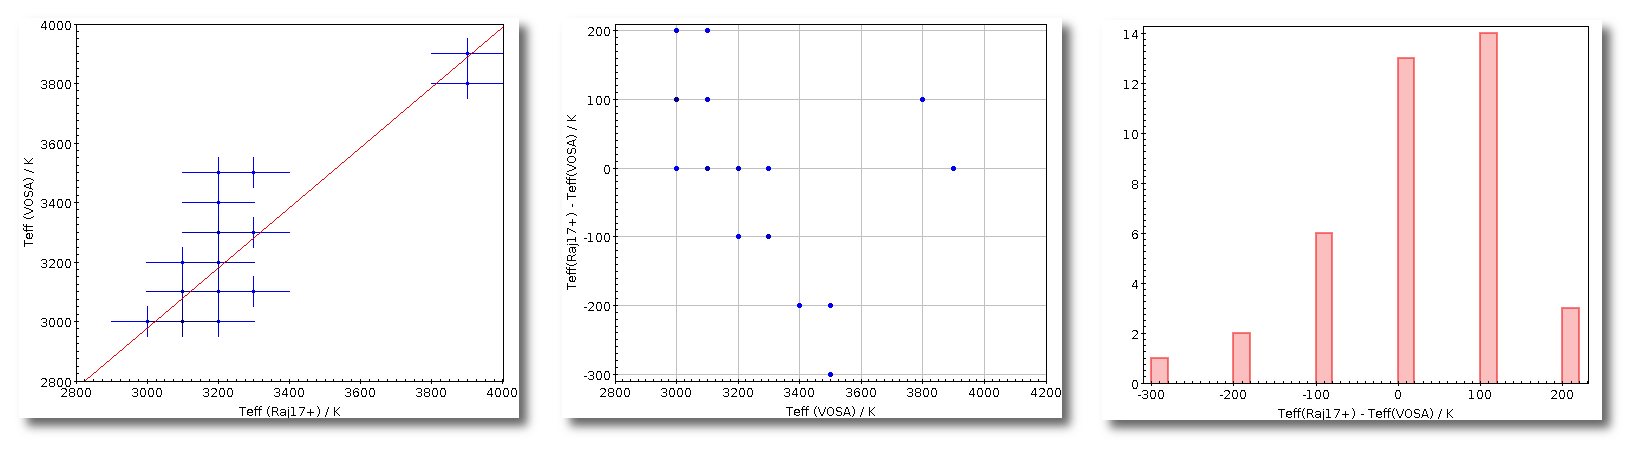
Efective temperatures computed by VOSA are in agreement with those given by Rajpurohit et al. (2017) in the studied range from 3000 to 4000 K, with some dispersion towards higher values between 3100 and 3300 K. On average, temperatures provided by VOSA are systematically lower by less than 100 K and standard deviations are below 150 K for both BT-Settl and CIFIST models.
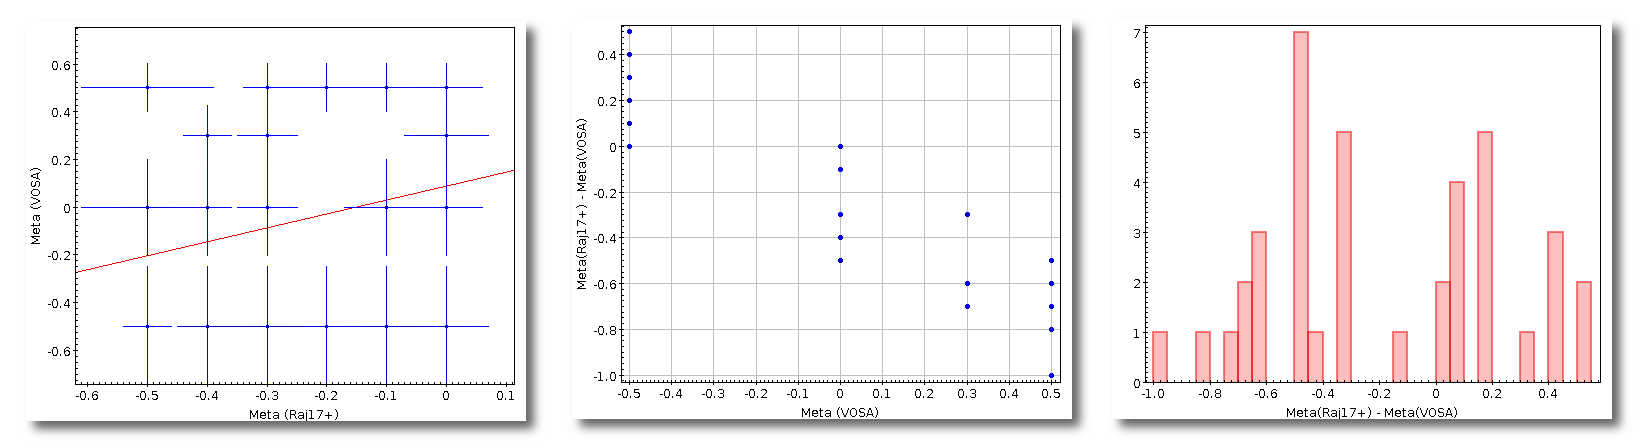
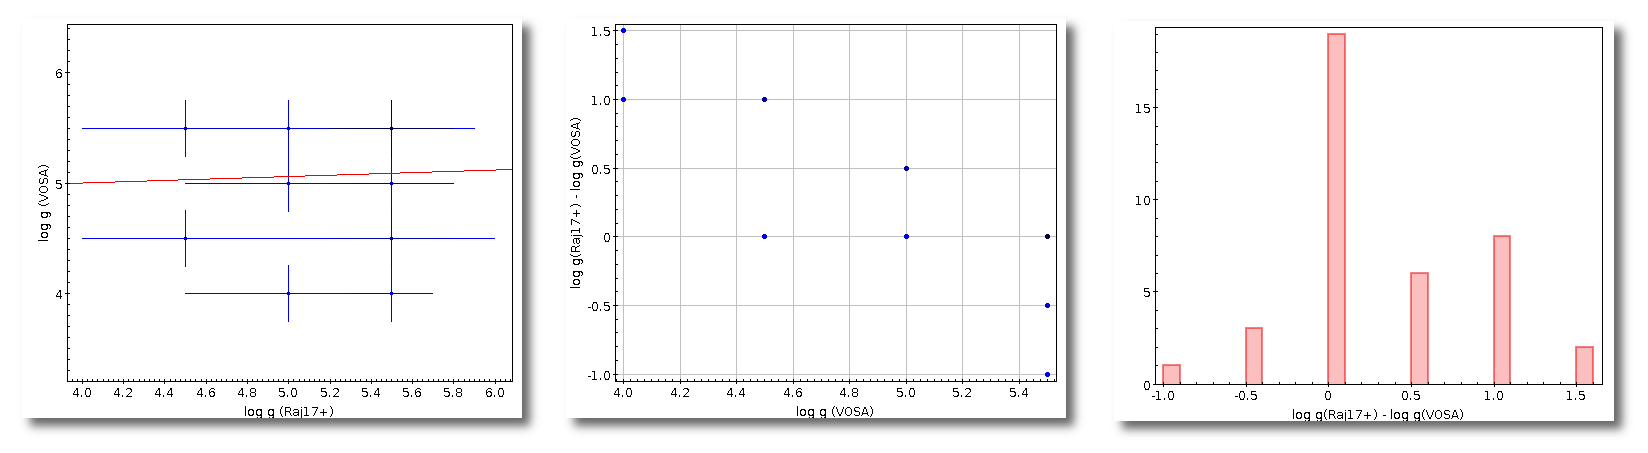
Surface gravities, metallicities
Metallicities and surface gravities provided by VOSA are not reliable due to the minor contribution of these parameters to the SED shape.
Sample and input parameters
Rajpurohit et al. 2017
Parameter determination for 45 M dwarfs using spectral synthesis employing BT-Settl models and high-resolution spectra taken with APOGEE on the Sloan 2.5 m Telescope at Apache Point Observatory in the H band:
H band (1.51 - 1.7 μm)
R ~ 22 500
Stellar properties:
Spectral types: M1.0 - M8.0 V
3100 < Teff [K] < 3900 (± 100 K)
-0.50 < [Fe/H] < +0.50 with errors between 0.03 and 0.11.
4 < logg [cm s2] < 5.5 with errors between 0.2 and 0.5.
SED building using VOSA
Photometric SED built using photometry from GALEX, Johnson, SDSS, APASS, Gaia, IPHAS, DENIS, UKIDSS, 2MASS, WISE and AKARI, retrieved from VO services.
Model fit using BT-Settl (logg: 4 - 5.5, [Fe/H]: -0.5 - 0.5, Teff:3000 - 4000 K).
Model fit using BT-Settl CIFIST (logg: 4 - 5.5, [M/H] = 0, Teff:3000-4000 K).
Parameters determination
We performed this analysis using BT-Settl models and used the more recent BT-Settl CIFIST models for comparison.
Of the 45 M dwarfs of the analysis, only four had parallactic distances retrieved from VO services and another six had not enough photometric data for the fit.
Both models provide quite similar values for the effective temperatures and are overall consistent within the errorbars with those given in Rajpurojit et al. (2017).
Figure 1: Effective temperatures using BT-Settl. Correlation coefficient r=0.85.Figure 2: Effective temperatures using BT-Settl CIFIST. Correlation coefficient r=0.84.
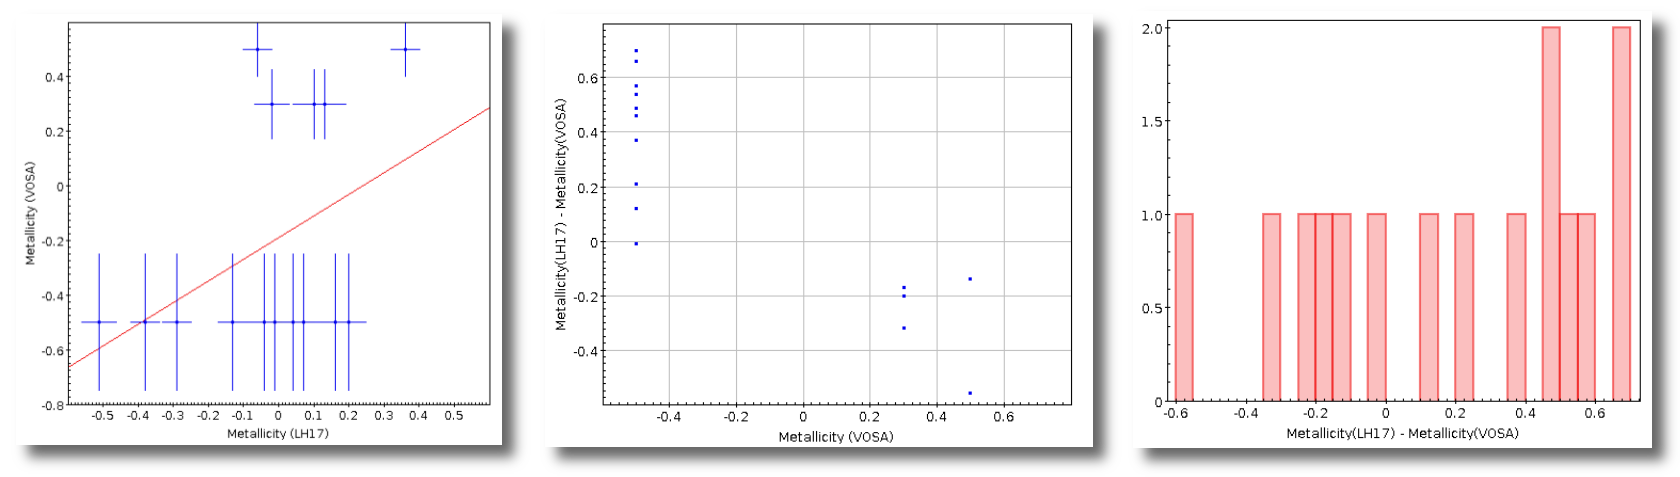
No good determination of the metallicities using VOSA. On average, metallicities obtained using BT-Settl models differ with the values given by Rajpurohit et al. (2017) by more than 7σ.
Figure 3: Metallicities using BT-Settl. Correlation coefficient r=0.25.
The surface gravities given by VOSA strongly differ with those given by Rajpurohit et al. (2017) for near half of the analyzed sample. Hence, these values are not trustworthy.
Figure 4: Surface gravities using BT-Settl. Correlation coefficient r=-0.22.Figure 5: Surface gravities using BT-Settl CIFIST. Correlation coefficient r=-0.29.


 Use Case