Quality: VO photometry tests
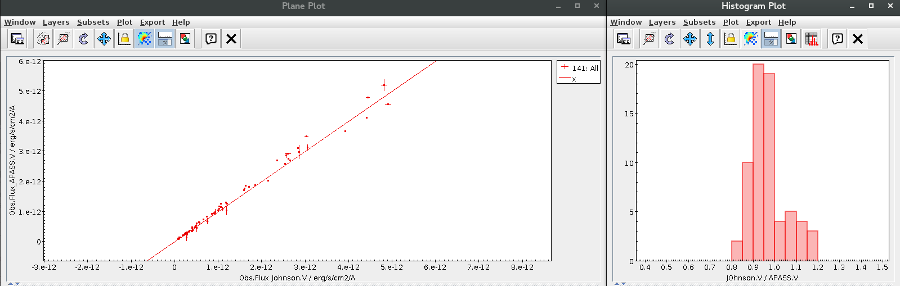
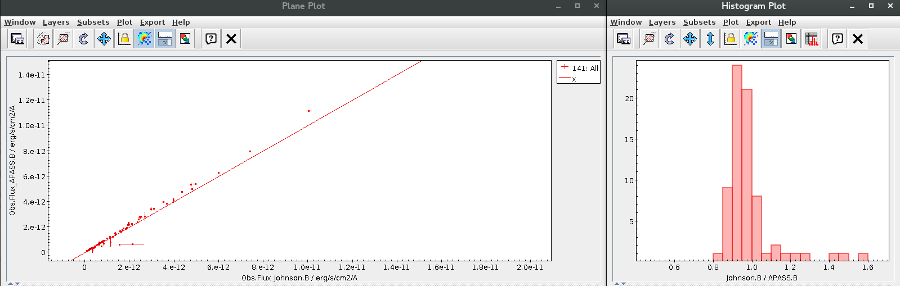
Flux comparison: APASS DR9 / Johnson (B,V bands)
Date of this test: 2016/10/08
Sample: 100 good sources.
Conclusion: APASS fluxes are systematically higher in both bands (typically 10%) (Figures 3,4).
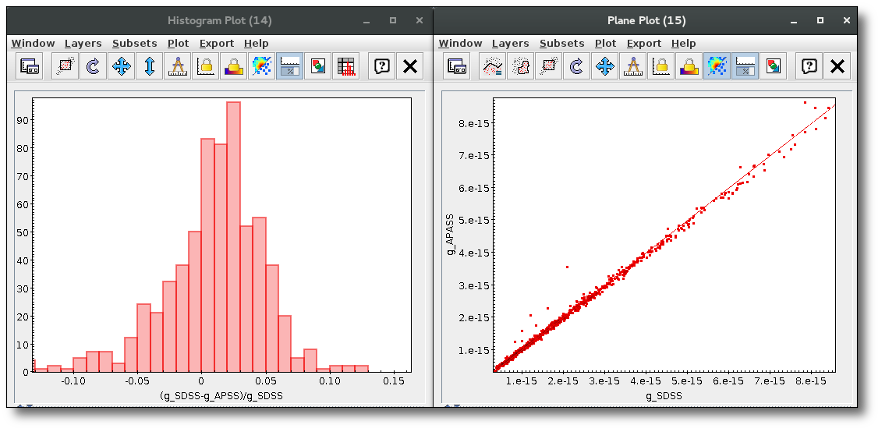
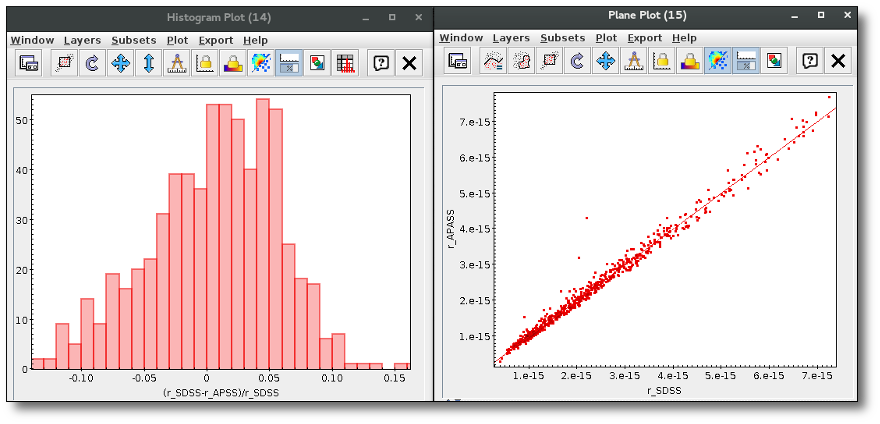
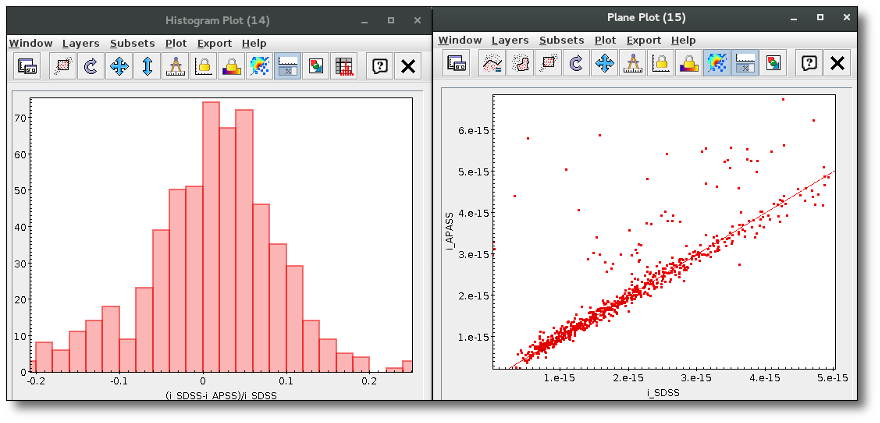
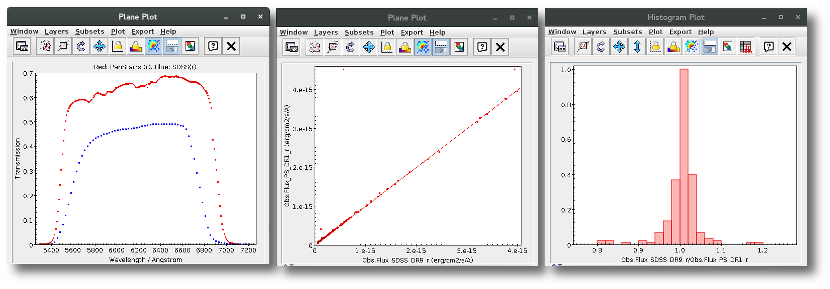
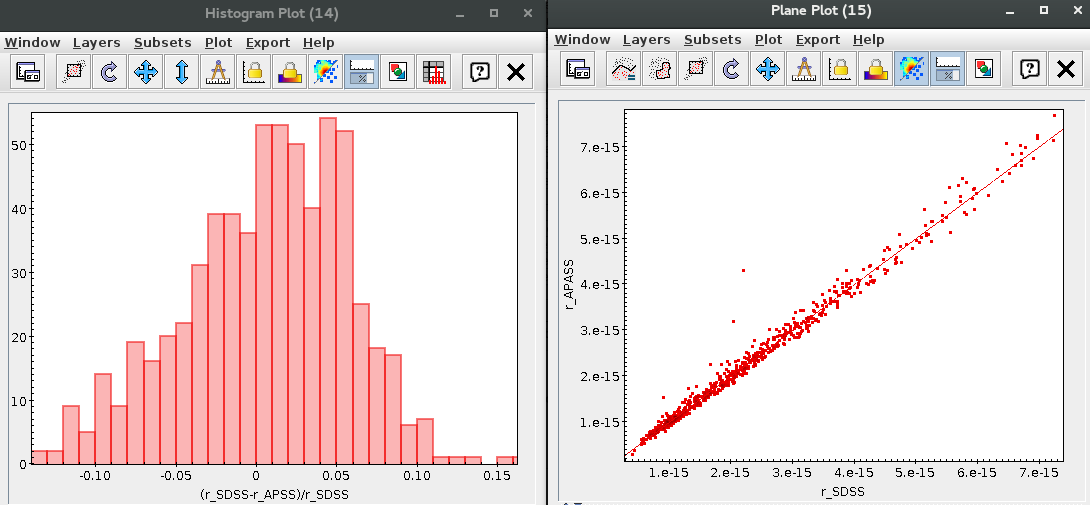
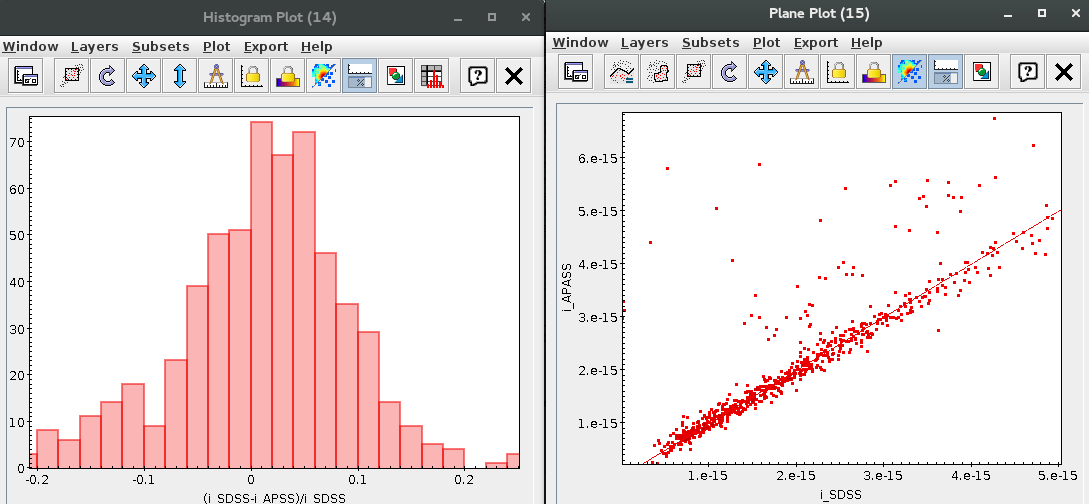
Flux comparison: SDSS DR12 / APASS DR9 (g,r,i bands)
Date of this test: 2020/06/01
(Download this test in pdf)
Sample: We have taken a sample of 664 objects in common in both catalogues and have compared the fluxes provided by VOSA.
Methodology:
- Search in SDSS DR12 around RA: 10.0 deg DEC: 10.0 deg. Radius: 5 deg. The search was limited to 100 000 objects
- gmag>14 && rmag>14 && imag>14 (to avoid saturated sources) --> 99 414 sources
- q_mode = "+" (good SDSS photometry) --> 44 555 sources
- e_gmag/gmag<0.1 && e_rmag/rmag<0.1 && e_imag/imag<0.1 (good SDSS photometry) --> 44 528 sources
- class = 6 (to keep SDSS point sources only) --> 14 917 sources
- Crossmatched with APASS DR9 using CDS x-match (1 arcsec radius to avoid missmatches) --> 751 sources
- e_gpmag/gpmag<0.1 && e_rpmag/rpmag<0.1 && e_ipmag/ipmag<0.1 (good APASS photometry) --> 664 sources
Conclusions:
- g,r band: No bias.
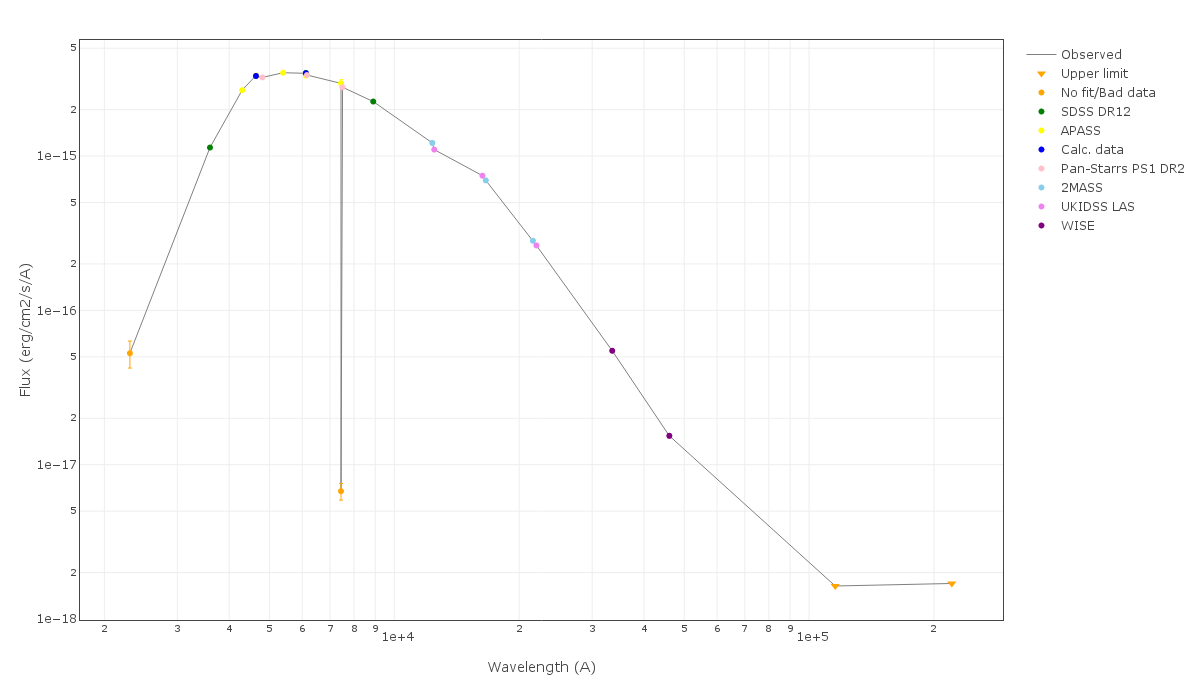
- i band: Almost 7% of the sources show fluxes significantly lower in SDSS than in ADASS. These discrepancies are already present in the magnitudes of the original catalogues and are not related to the transformations from magnitudes into fluxes. As we can see in the last figure, the problem affects to SDSS values while APASS values nicely fit the spectral energy distribution.
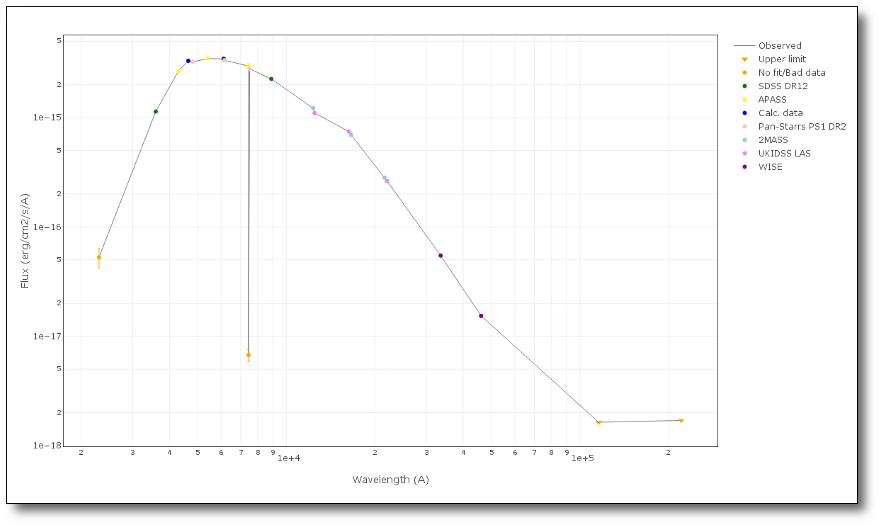
RA: 10.57339; DEC: 5.34662
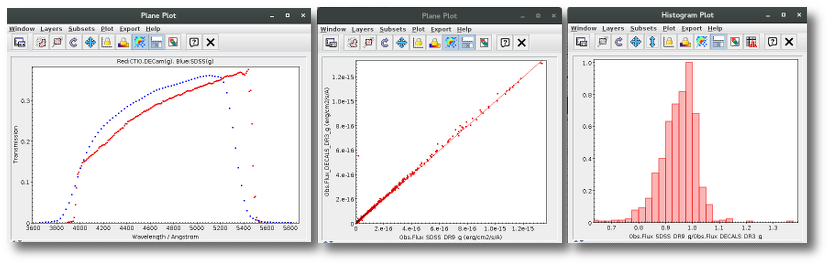
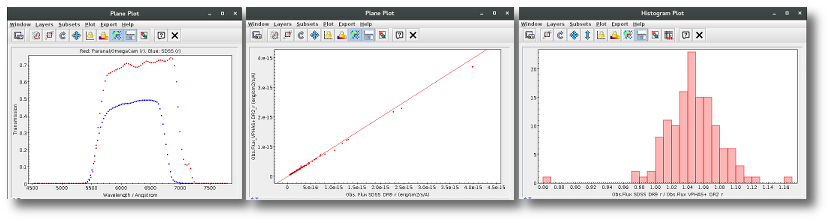
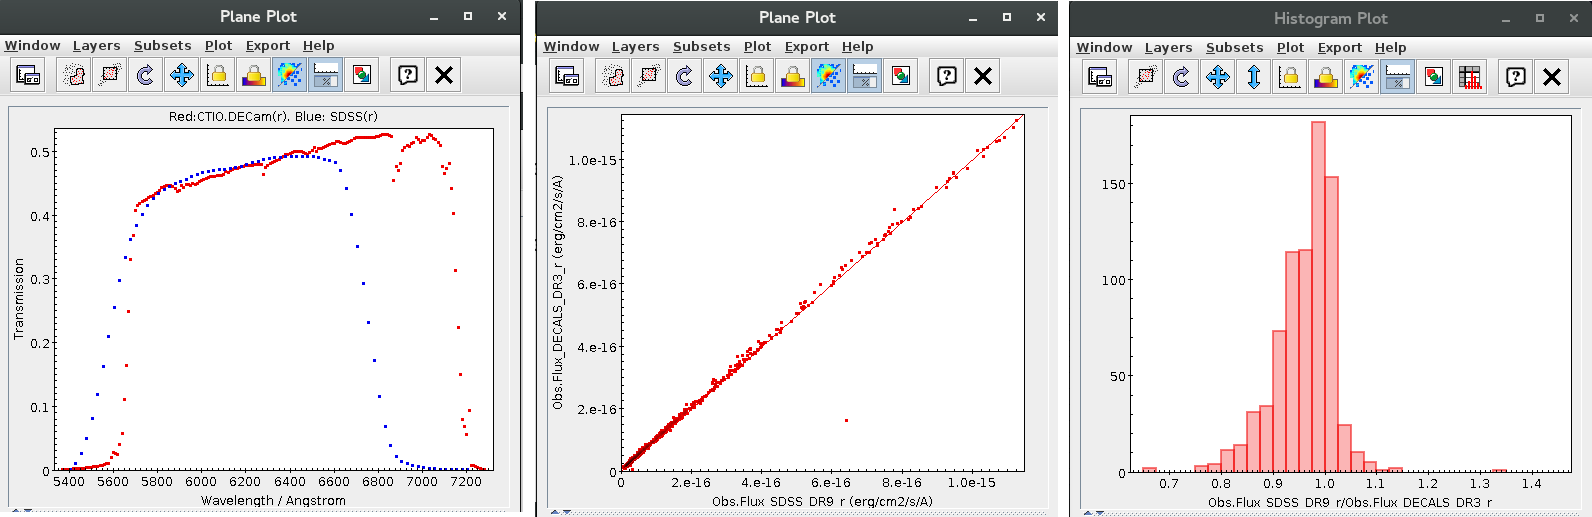
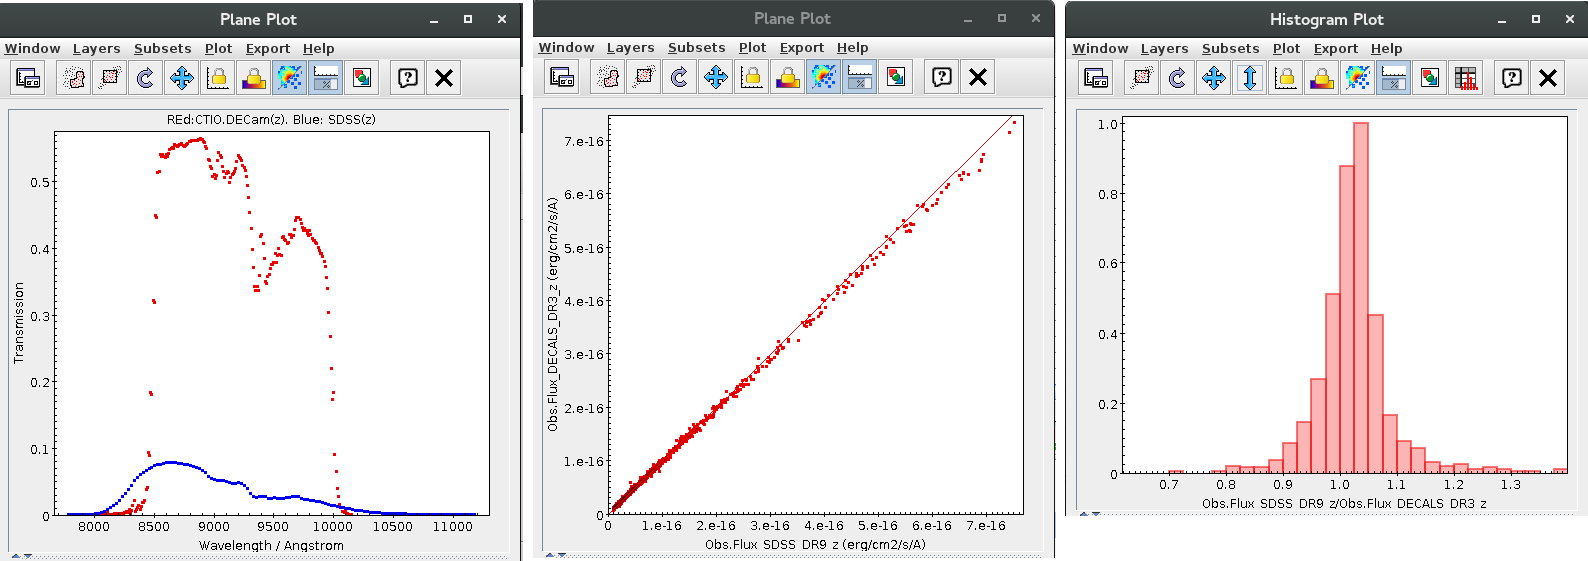
Flux comparison: SDSS DR9 / CTIO.DECam (g,r,z bands)
Date of this test: 2017/05/08
Sample: we have taken a good quality sample of 784 objects in common in both catalogues and have compared the fluxes provided by VOSA.
Methodology:
- Search around RA:328.3deg DEC:17.5deg. Radius:0.5deg.
- Crossmatching (search radius:0.2arcsec)
- Filtering (magnitudes below the limiting magnitude, errors in magnitude below 0.2 and good quality (qmode, cl=6,decam_anymask)
gmag<22.2 && rmag<22.2 && zmag<20.5 && e_gmag<0.2 && e_rmag<0.2 && e_zmag<0.2 && qmode && cl==6 && decam_anymask_1==0 && decam_anymask_2==0 && decam_anymask_3==0 && decam_anymask_4==0 && decam_anymask_5==0 && g<24.7 && r<23.9 && z<23
Conclusions:
| band |
g |
r |
z |
| Median (SDSS/VPHAS+) |
0.957 |
0.973 |
1.024 |
| Q10 (SDSS/VPHAS+) |
0.861 |
0.882 |
0.959 |
| Q90 (SDSS/VPHAS+) |
1.017 |
1.018 |
1.083 |
g band
r band
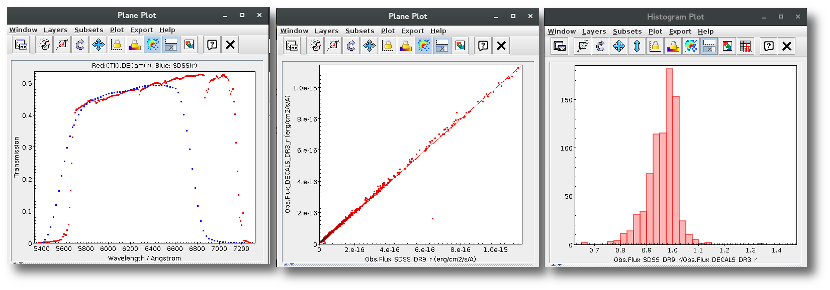
z band
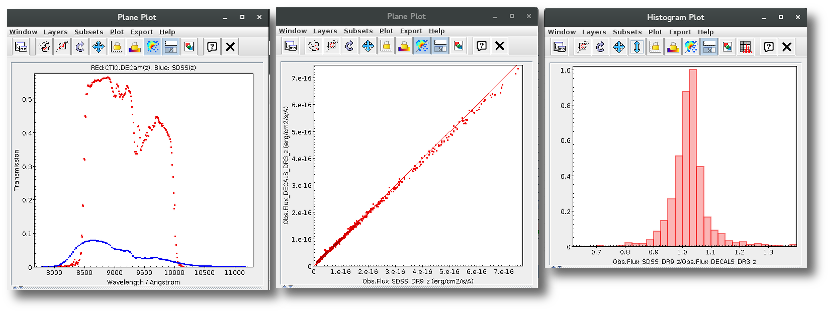
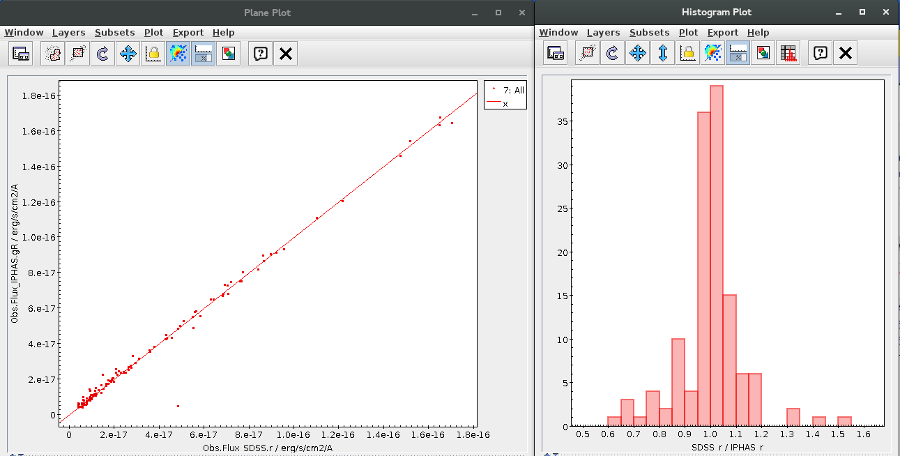
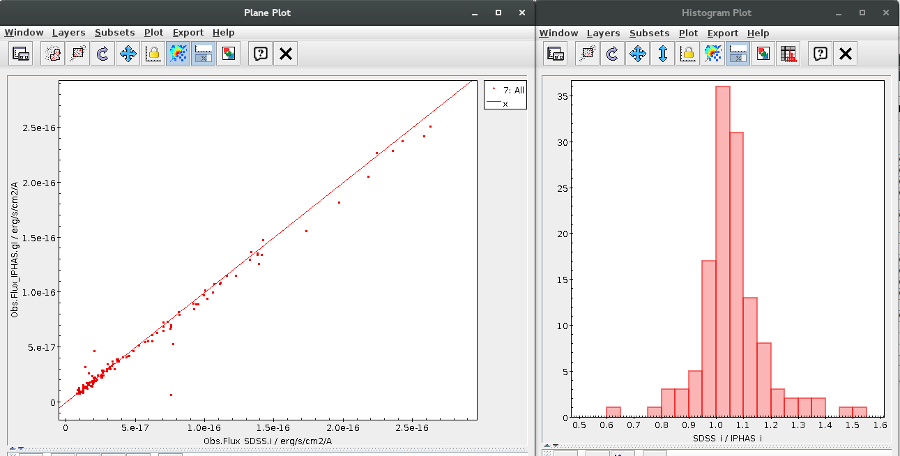
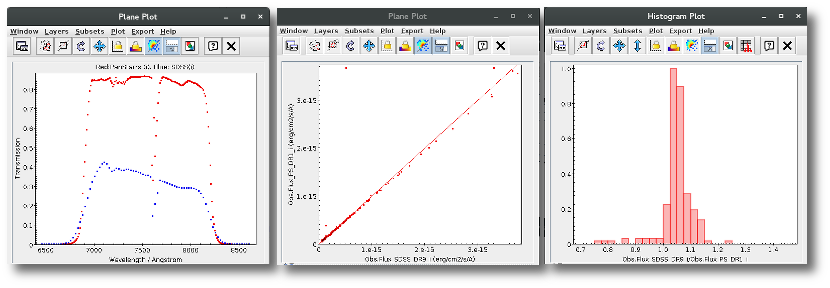
Flux comparison SDSS DR9 / IPHAS DR2 (r,i bands)
Date of this test: 2016/10/08
We have taken a sample of "good" (no quality flags) sample of 200 objects in common in both catalogues and have compared the fluxes provided by VOSA.
Methodology
- Search around RA:60.0deg DEC:-52.0deg. Radius:0.2deg.
- Crossmatched using CDS x-match
- Filtering $0<200&&rErr>0&&iErr>0&&rmag<22.2&&rmag>14&&imag<21.3&&imag>14&&q_mode
Conclusions:
- r band: No bias. Differences in flux typically less than 10% (figure1)
- i band: SDSS fluxes are systematically higher. Differences in flux are typically less than 15 % (figure 2).
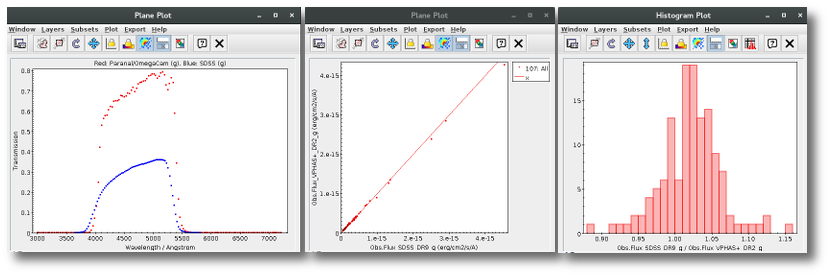
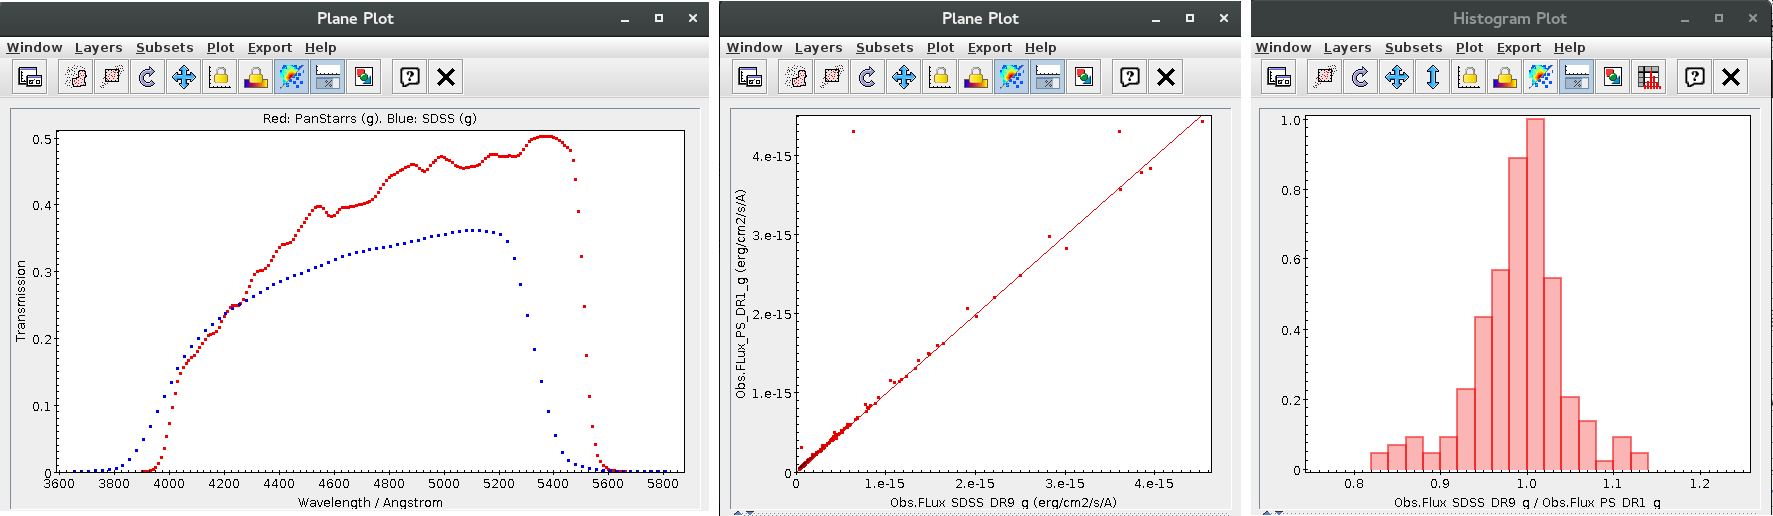
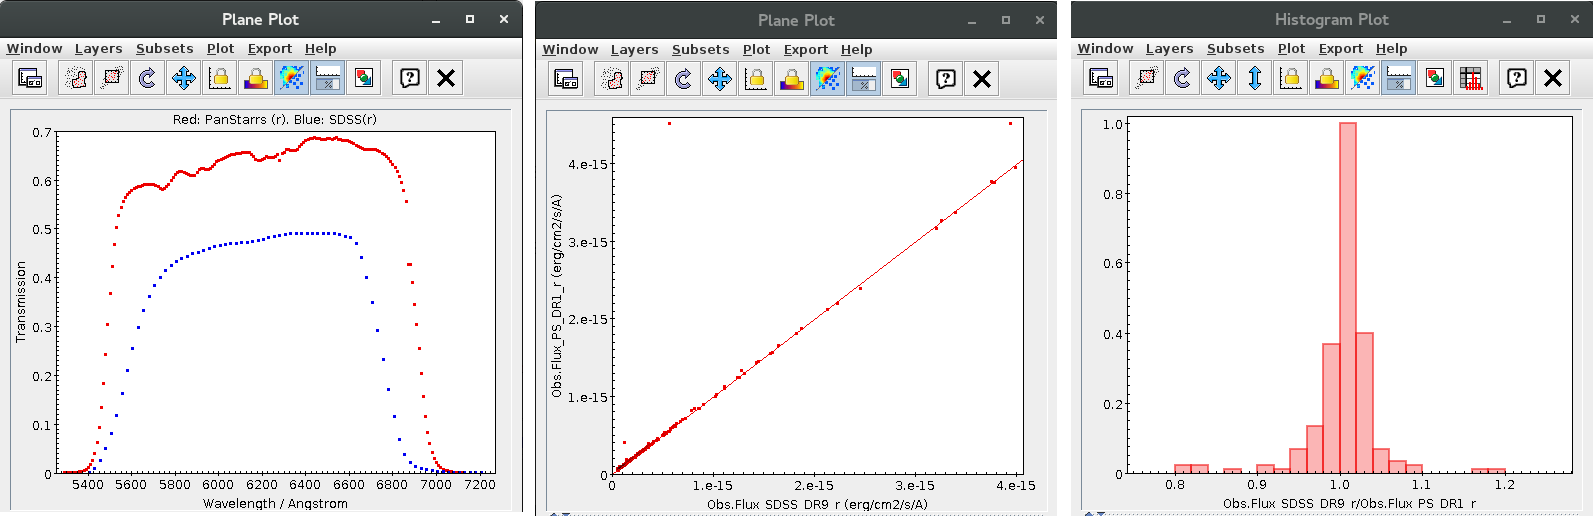
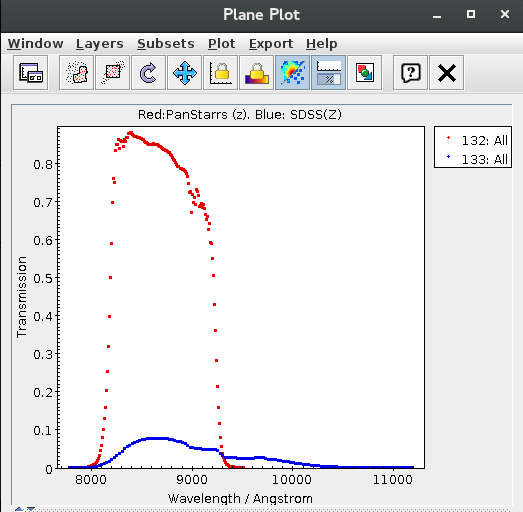
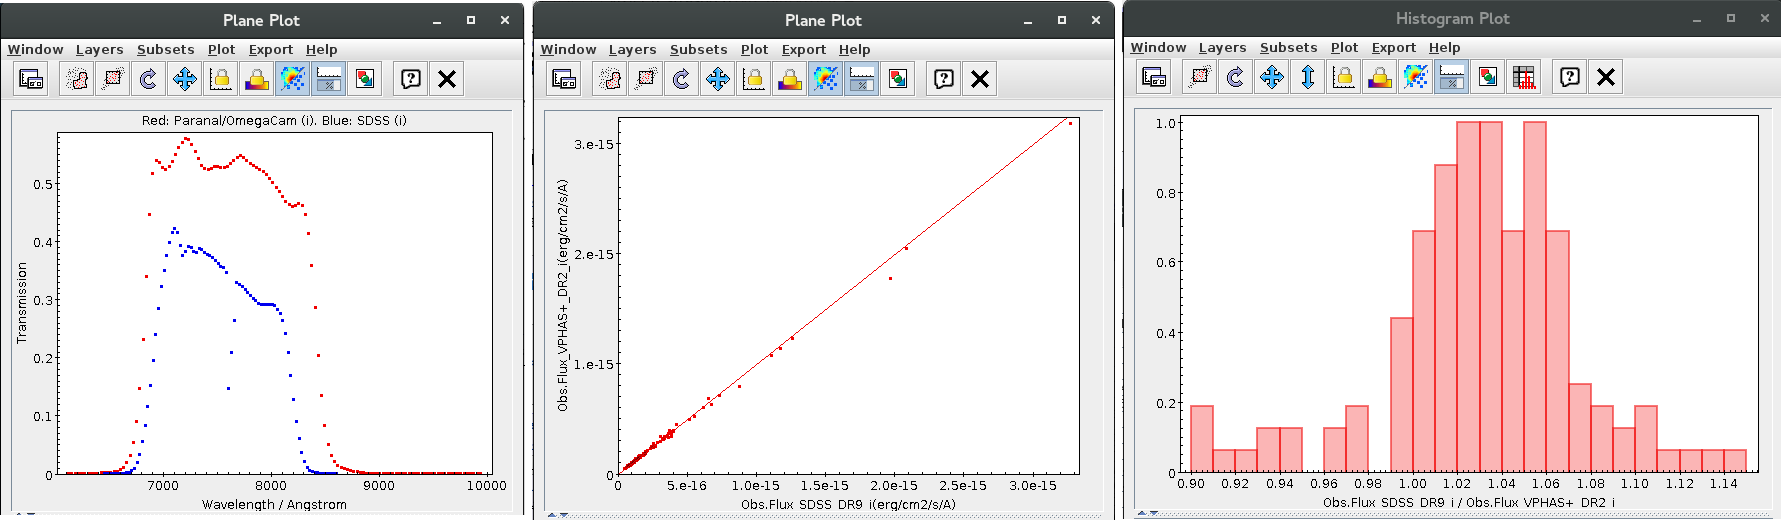
Flux comparison: SDSS DR9 / PanSTARRS DR1 (g,r,i,z bands)
Date of this test: 2017/05/08
Sample: we have taken a good quality sample of 200 objects in common in both catalogues and have compared the fluxes provided by VOSA.
Methodology:
- Search around RA:101.0deg DEC:0.0deg. Radius:0.5deg.
- Crossmatching (radius 0.2 arcsec).
- Filtering (magnitudes below the limiting magnitude, errors in magnitude below 0.2 and good quality (qmode, cl=6,quality_flag<64)
$0<201 && contains(toString(q_mode),"+") && cl==6 && umag<22.0 && gmag<22.2 && rmag<22.2 && imag<21.3 && e_umag<0.2 && e_gmag<0.2 && e_rmag<0.2 && e_imag<0.2 && qualityflag<64 && gMeanApMagErr<0.2 && rMeanApMagErr<0.2 && iMeanApMagErr<0.2 && zMeanApMagErr<0.2 && gMeanApMag<23.3 && rMeanApMag<23.2 && iMeanApMag<23.1 && zMeanApMag<22.3
Conclusions:
| band |
g |
r |
i |
z |
| Median (SDSS/VPHAS+) |
0.994 |
1.011 |
1.051 |
--- |
| Q10 (SDSS/VPHAS+) |
0.924 |
0.972 |
1.013 |
--- |
| Q90 (SDSS/VPHAS+) |
1.043 |
1.032 |
1.105 |
--- |
g band
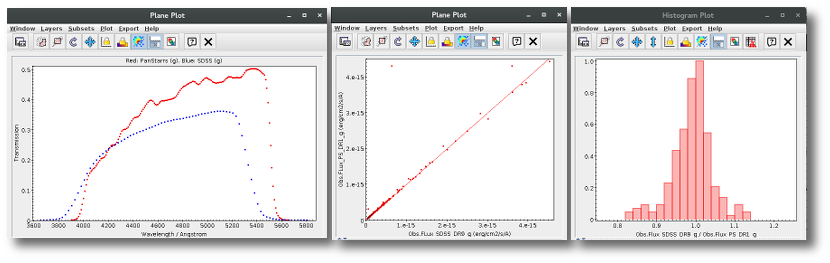
r band
i band
z band (No comparison was performed due to the significant differences both in wavelength coverage and shape between the two filters).
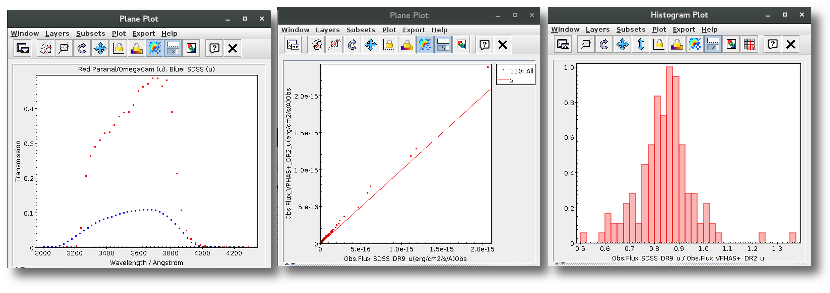
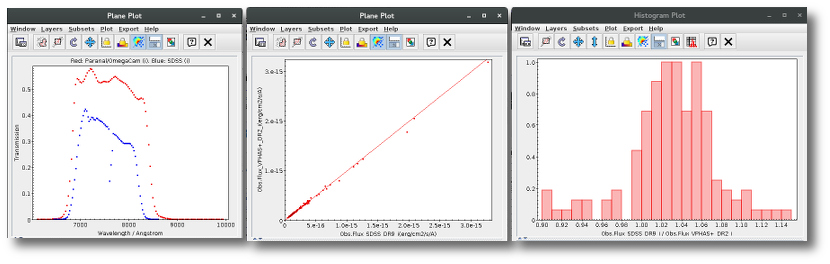
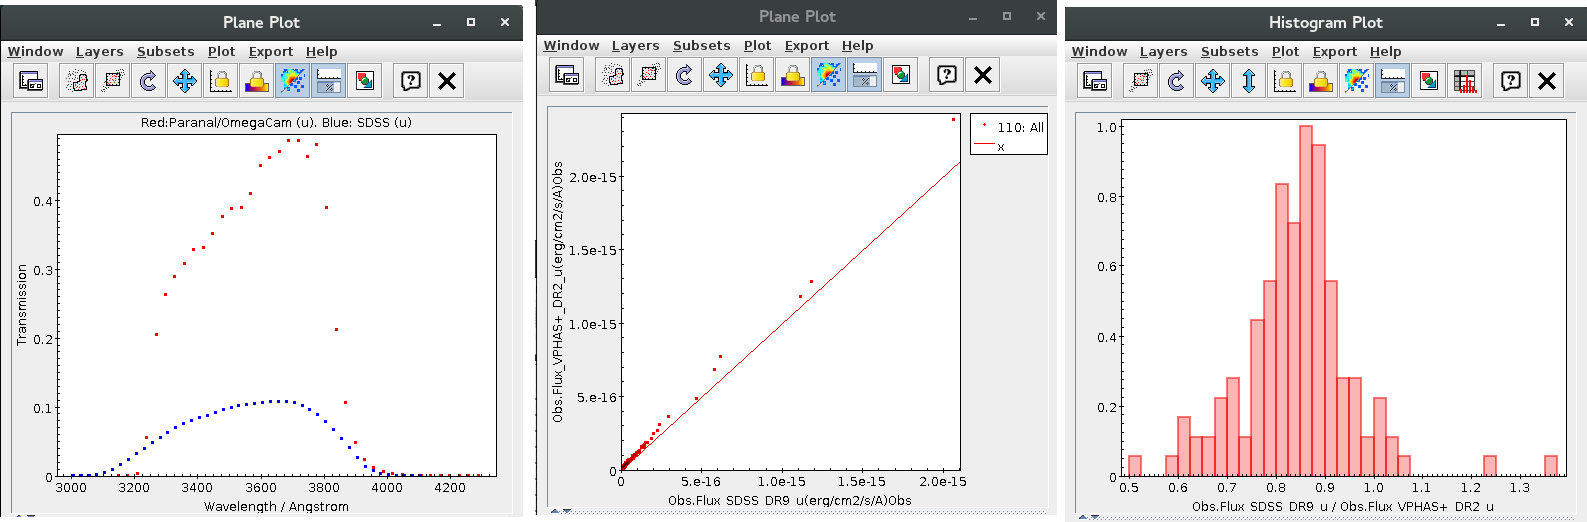
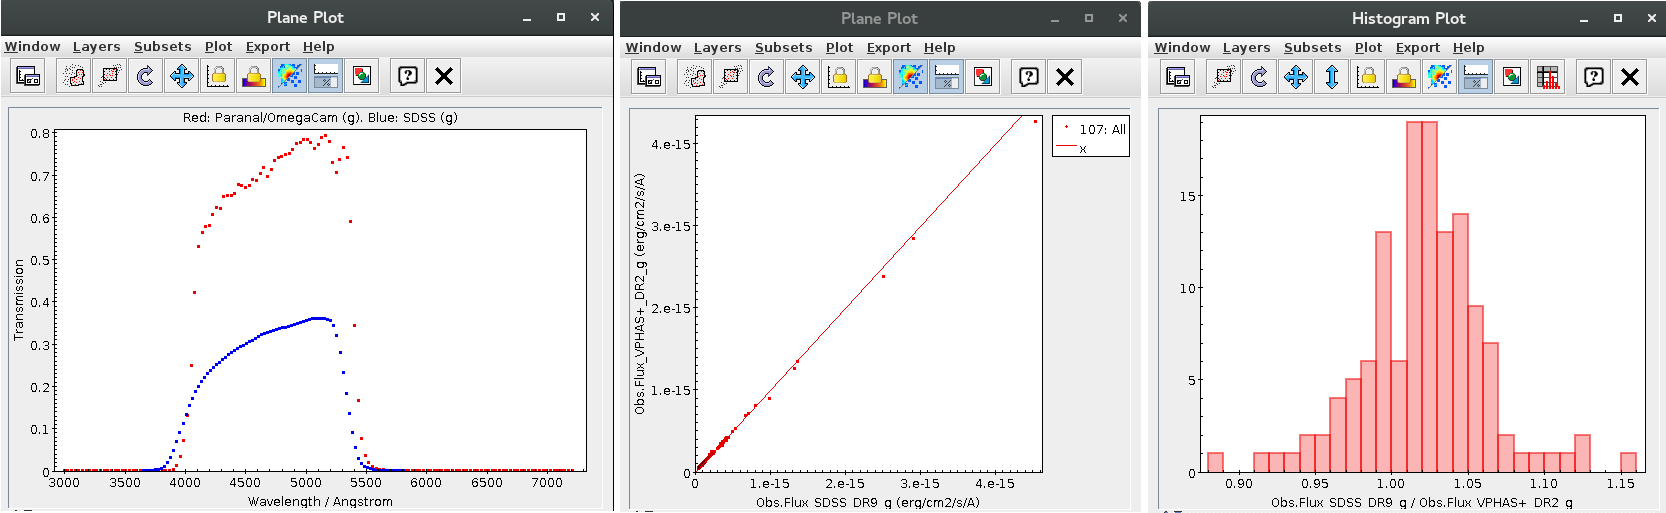
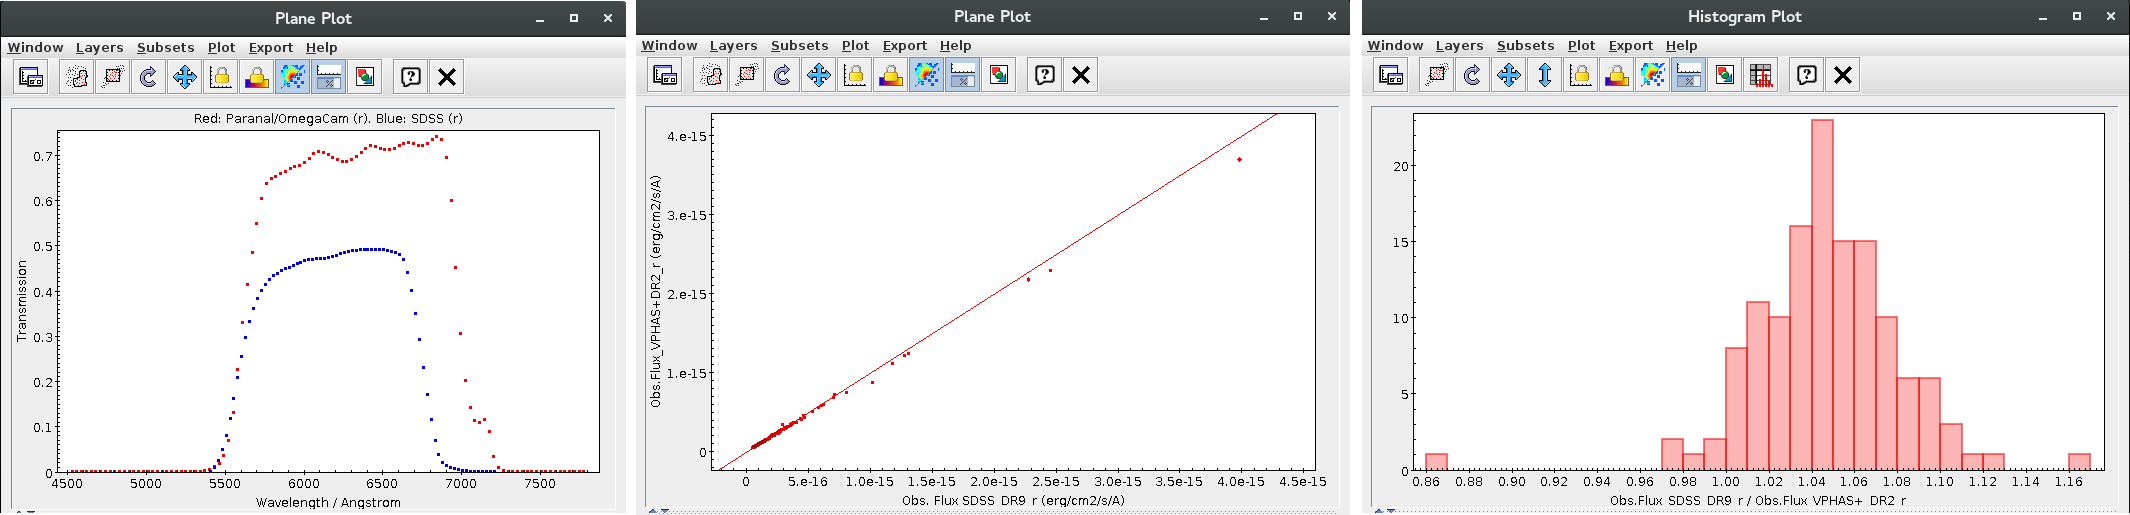
Flux comparison: SDSS DR9 / VPHAS DR2 (u,g,r,i bands)
Date of this test: 2017/05/08
Sample: we have taken a good quality sample of 119 objects in common in both catalogues and have compared the fluxes provided by VOSA.
Methodology:
- Search around RA:101.0deg DEC:0.0deg. Radius:0.5deg.
- Crossmatched using CDS x-match (radius=0.2arcsec).
- Filtering (magnitudes below the limiting magnitude, errors in magnitude below 0.2 and good quality (qmode, cl=6,clean)
$0<3000 && umag<22.0 && gmag<22.2 && rmag<22.2 && imag<21.3 && e_umag<0.2 && e_gmag<0.2 && e_rmag<0.2 && e_imag<0.2 && qmode && cl==6 && umag_x<22.0 && gmag_x<22.0 && rmag_x<22.0 && imag_x<22.0 && e_umag_x<0.2 && e_gmag_x<0.2 && e_rmag_x<0.2 && e_imag_x<0.2 && clean
Conclusions:
| band |
u |
g |
r |
i |
| Median (SDSS/VPHAS+) |
0.851 |
1.023 |
1.048 |
1.030 |
| Q10 (SDSS/VPHAS+) |
0.701 |
0.973 |
1.008 |
0.977 |
| Q90 (SDSS/VPHAS+) |
0.953 |
1.063 |
1.085 |
1.075 |
u band
g band
r band
i band
>
XMM testing with VOSA
Date of this test: 2019/08/21 (by Miriam Cortés Contreras)
(Download this test in pdf)
Summary
We tested the XMM-OM Serendipitous Source Survey Catalogue 1 [XMM-
SUSS4.1, Page et al., 2012] in VOSA. To do that, we selected "good" sources from the catalogue with counterpart in GALEX DR2 AIS (All-sky Imaging
Survey) [Bianchi et al., 2011]. On one hand, we compared the observed fluxes in XMM filters with the theoretical fluxes predicted by the model, aiming
at proving their good fitting to the theoretical SED. On the other hand, we
compared the observed fluxes in XMM filters with fluxes in similar filters in
the ultraviolet and the optical wavelenght range.
Methodology
- From the XMM-SUSS4.1 Catalogue with 8 176 156 sources, we selected
sources without quality flag, classified as point-like and with magnitude
errors under 0.2 mag:
q.UVW2=="FFFFFFFFFFFF" && q.uVM2=="FFFFFFFFFFFF" && q.UVW1=="FFFFFFFFFFFF"
&& q.U=="FFFFFFFFFFFF" && q.B=="FFFFFFFFFFFF" && q.V=="FFFFFFFFFFFF"
&& xUVW2==0 && xUVM2==0 && xUVW1==0 && xU==0 && xB==0 && xV=0
&& e_UVW2mAB<=0.2 && e_UVM2mAB<=0.2 && e_UVW1mAB<=0.2 && e_UmAB<=0.2
&& e_BmAB<=0.2 && e_VmAB<=0.2
862 sources remain.
- We cross-matched this sample within 1 arcsec by using the CDS-Xmatch
with GALEX DR2 AIS. We obtained 207 matches.
- We uploaded these sources' coordinates to VOSA and gathered VO photometry from 2MASS, DENIS, WISE, CMC14, APASS9, Gaia DR2,
Pan-Starrs PS1, XMM-SUSS4.1, GALEX, VHS DR3, VIDEO DR4,
Dark Energy Survey SVA1 Gold, SDSS DR9, UKIDSS LAS DR10,
UKIDSS Ultra Deep Survet DR10 and VIKING DR4. No distances
were found for these targets.
- We performed a chi-square fit using BT-Settle models without any
parameter restriction. For 172 sources we obtained good SED fitting
(Vgfb < 15).
- We compare their observed fluxes in the following section.
Flux comparison
Observed vs. Model
We compared the observed fluxes in each of the five bands of XMM-SUSS4.1
with the theoretical fluxes predicted by the model in Figures 1 and 2.
Table 1: XMM flux comparison: observed vs. modeled.
| |
UVW2 |
UVM2 |
UVW1 |
U |
B |
V |
| Median (F Obs /F Mod) |
1.32 |
1.23 |
1.04 |
1.00 |
0.94 |
1.03 |
| Q10 (F Obs /F Mod) |
0.97 |
0.98 |
0.97 |
0.95 |
0.89 |
0.97 |
| Q90 (F Obs /F Mod) |
2.13 |
1.52 |
1.18 |
1.06 |
0.99 |
1.08 |
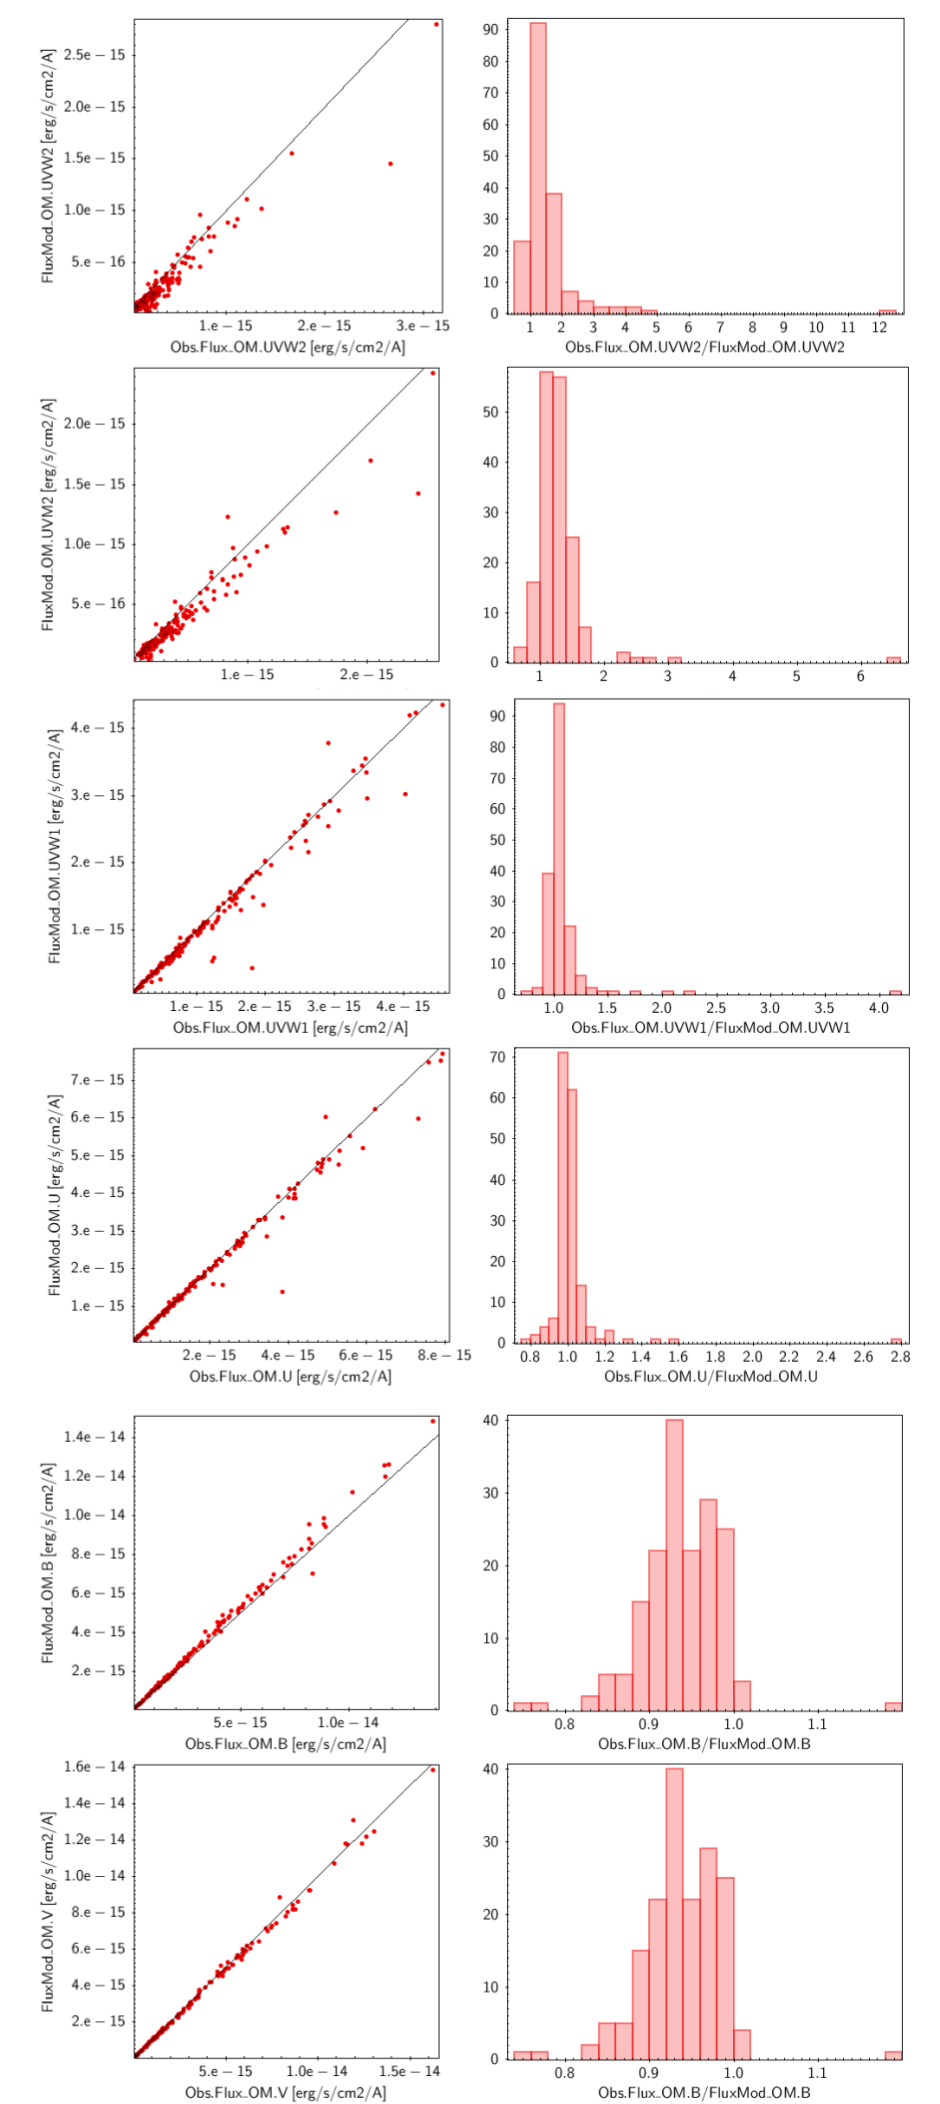 |
Figures 1 & 2: Comparison of observed and theoretical fluxes. |
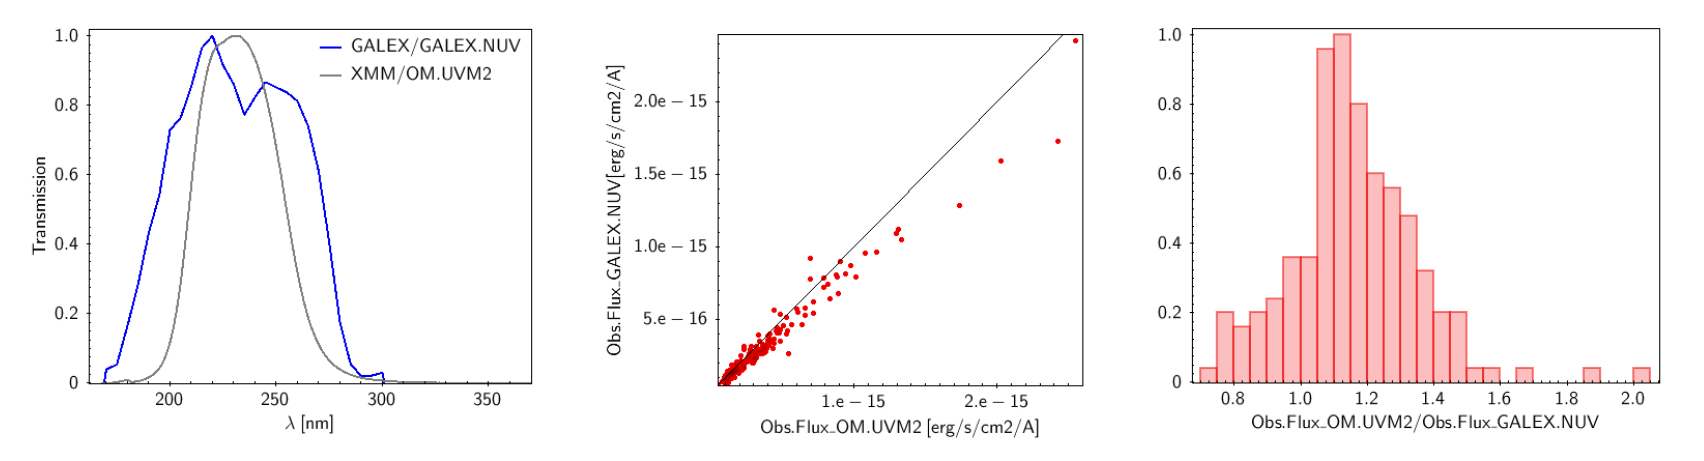
XMM vs. GALEX and APASS
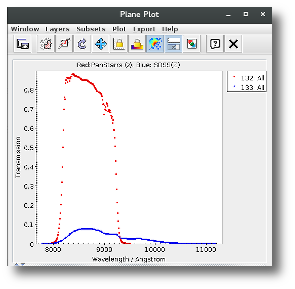
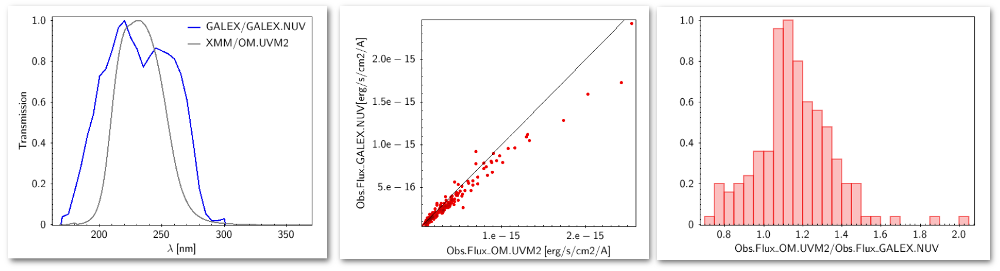
We compared the UVM2 band with the NUV filter of GALEX. Figure 3 shows
the normalized transmission curves of the filters, the comparison between
observed fluxes and the distribution of the flux ratio.
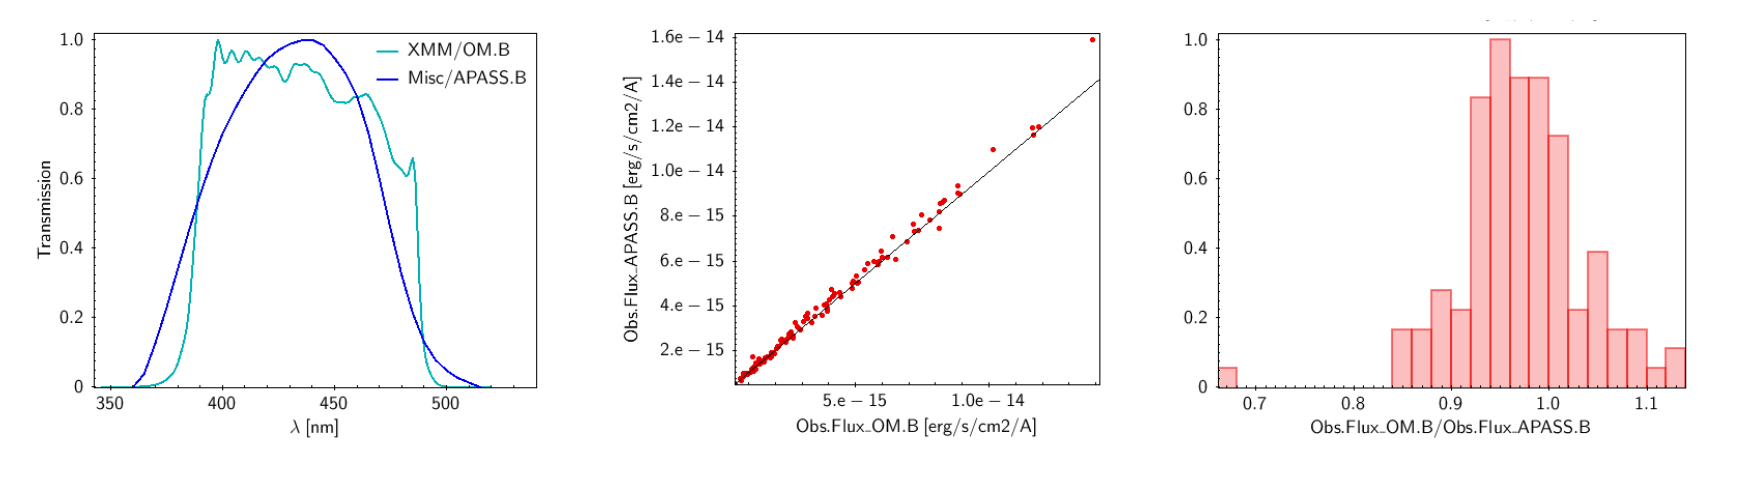
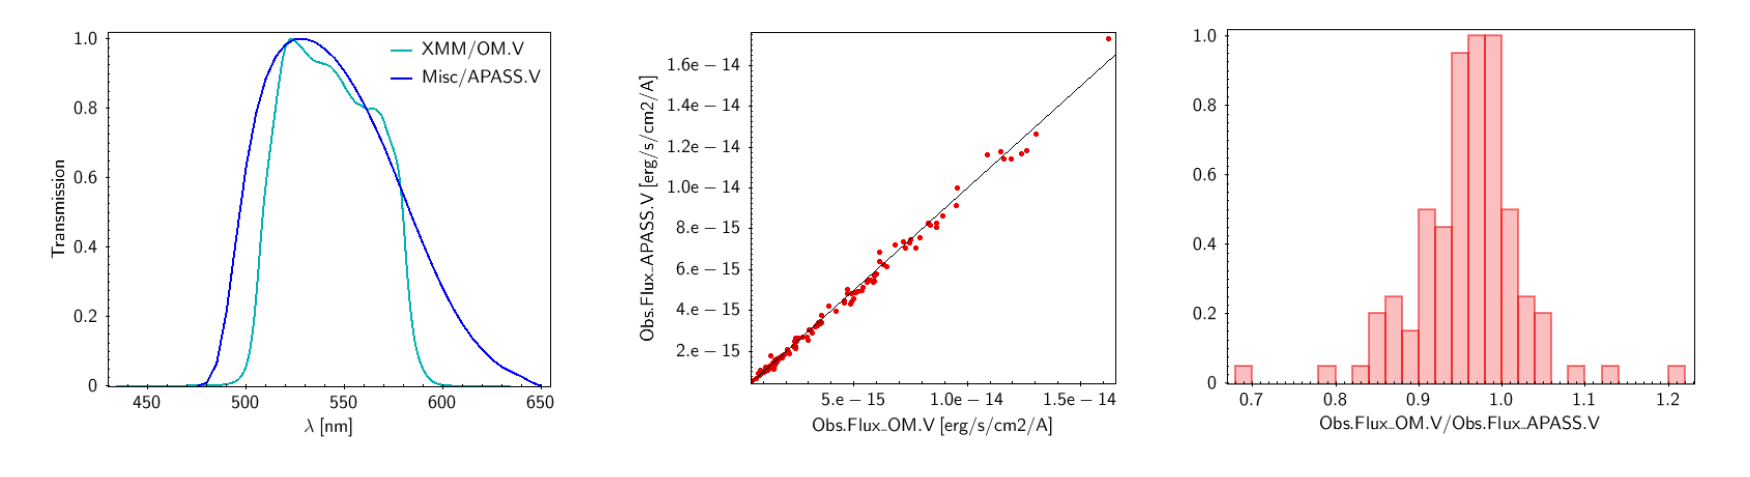
In the optical, we compared the B and V bands with the B and V filters
of APASS. Figures 4 and 5 show the normalized transmission curves of the
filters, the comparison between observed fluxes and the distribution of the
flux ratio.
Table 2: Flux comparison: XMM vs. GALEX and APASS.
| |
UVM2/NUV |
BXMM/BAPASS |
VXMM/VAPASS |
| Median (F Obs /F Mod) |
1.15 |
0.97 |
1.03 |
| Q10 (F Obs /F Mod) |
0.91 |
0.90 |
0.95 |
| Q90 (F Obs /F Mod) |
1.38 |
1.06 |
1.10 |
 |
| Figure 3: Comparison of filters and fluxes in the ultraviolet. |
|
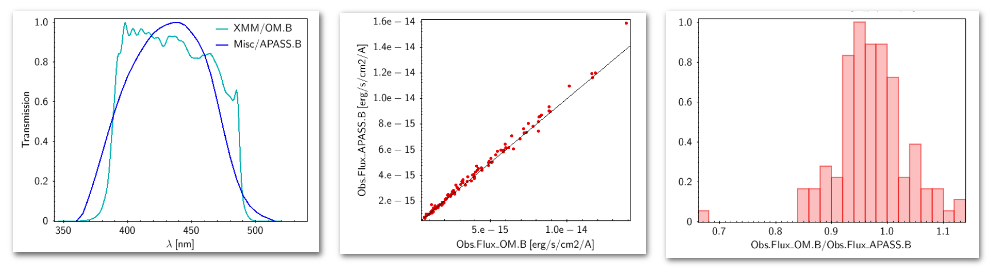 |
| Figure 4: Comparison of filters and fluxes in the B band. |
|
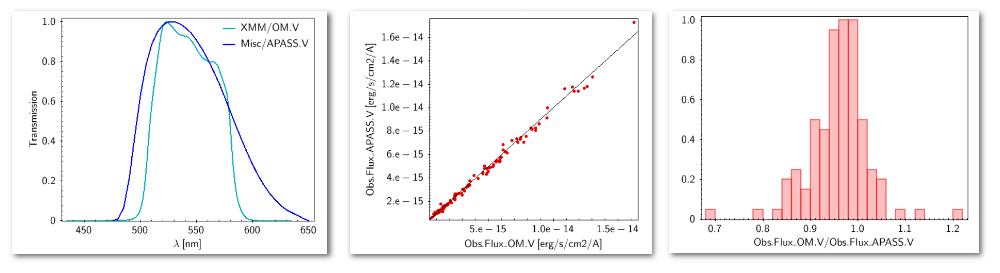 |
| Figure 5: Comparison of filters and fluxes in the V band. |
Conclusions
In the ultraviolet the differences between observed and modeled fluxes are
larger than in the optical (see Table 1).
Regarding the flux comparison with other filters, fluxes in the UVM2
band are systematically higher when comparing UVM2 with NUV. In the
optical, the comparison between the B and V bands of XMM and APASS
show very good agreement. (see Table 2).
An example of a SED fitted with BT-Settl using these bands is shown in
Figure 6.
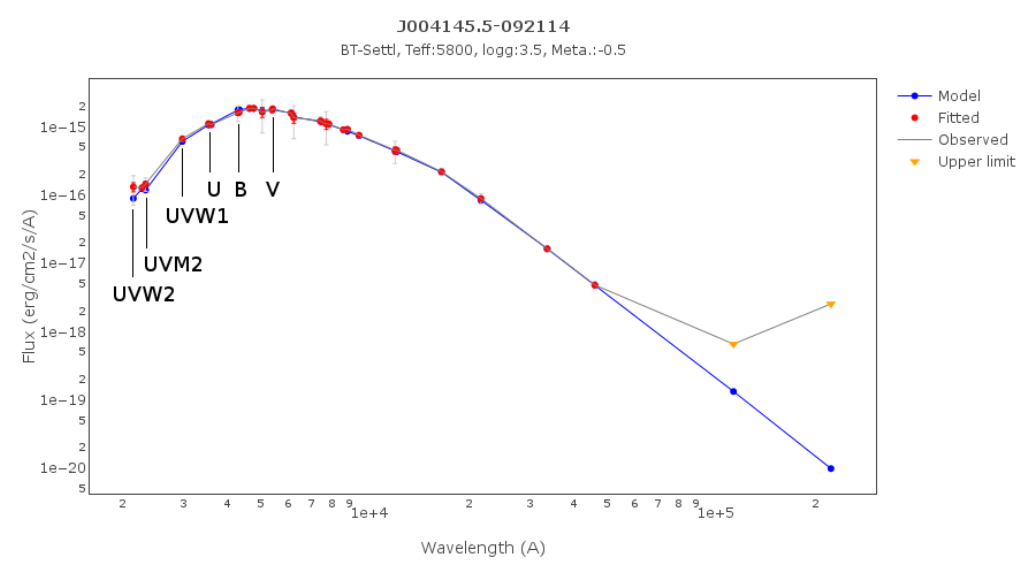 |
| Figure 6: Example |
References
- L. Bianchi, J. Herald, B. Efremova, L. Girardi, A. Zabot, P. Marigo, A. Conti, and B. Shiao. GALEX catalogs of UV sources: statistical properties and
sample science applications: hot white dwarfs in the Milky Way. , 335(1):
161-169, Sep 2011. doi: 10.1007/s10509-010-0581-x.
- M. J. Page, C. Brindle, A. Talavera, M. Still, S. R. Rosen, V. N. Yershov,
H. Ziaeepour, K. O. Mason, M. S. Cropper, A. A. Breeveld, N. Loiseau,
R. Mignani, A. Smith, and P. Murdin. The XMM-Newton serendipitous ultraviolet source survey catalogue. , 426(2):903-926, Oct 2012. doi: 10.1111/j.1365-2966.2012.21706.x.
Assessment of the GALEX GR5/MIS fluxes.
Date of this test: 2020/03/25
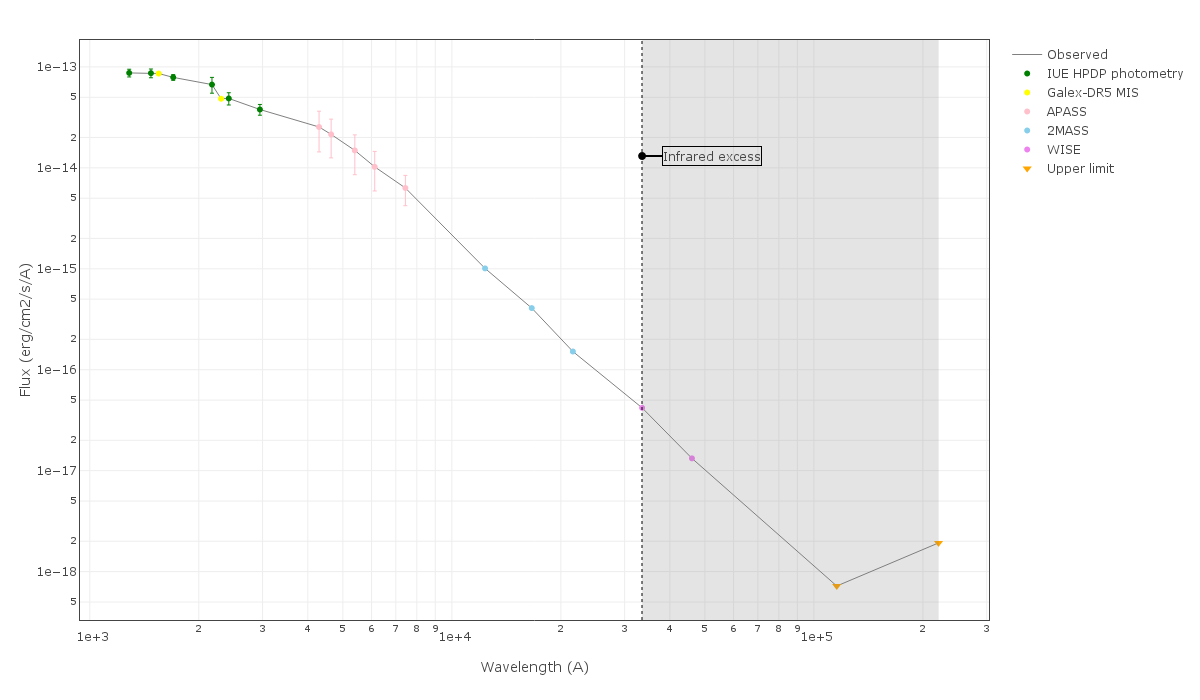
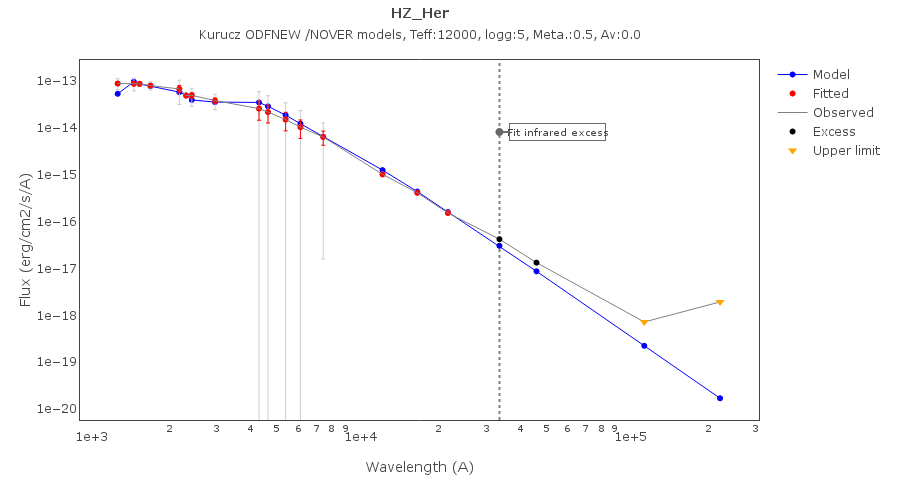
Goal: We want to check how the GALEX GR5/MIS (Bianchi et al. 2011) FUV and NUV fluxes fit in the overall SED.
Methodology
- Input catalogue: IUE HPDP (1451 objects). This archive provides fluxes of INES spectra at different photometric bands.
- Crossmatch with GALEX GR5/MIS (search radius: 5arcsec): 3 objects in common.
- Filtering
- Fafl=0 &Nafl=0 (good FUV, NUV photometry) --> 1 object
- Good overall SED fitting --> 1 object. V* HZ Her (Spectral type: B3-6; Low mass X-ray binary).
Conclusion:
- GALEX GR5/MIS FUV and NUV fluxes fit well in the overall SED.
Assessment of the GALEX GR6+7 fluxes.
Date of this test: 2020/03/25
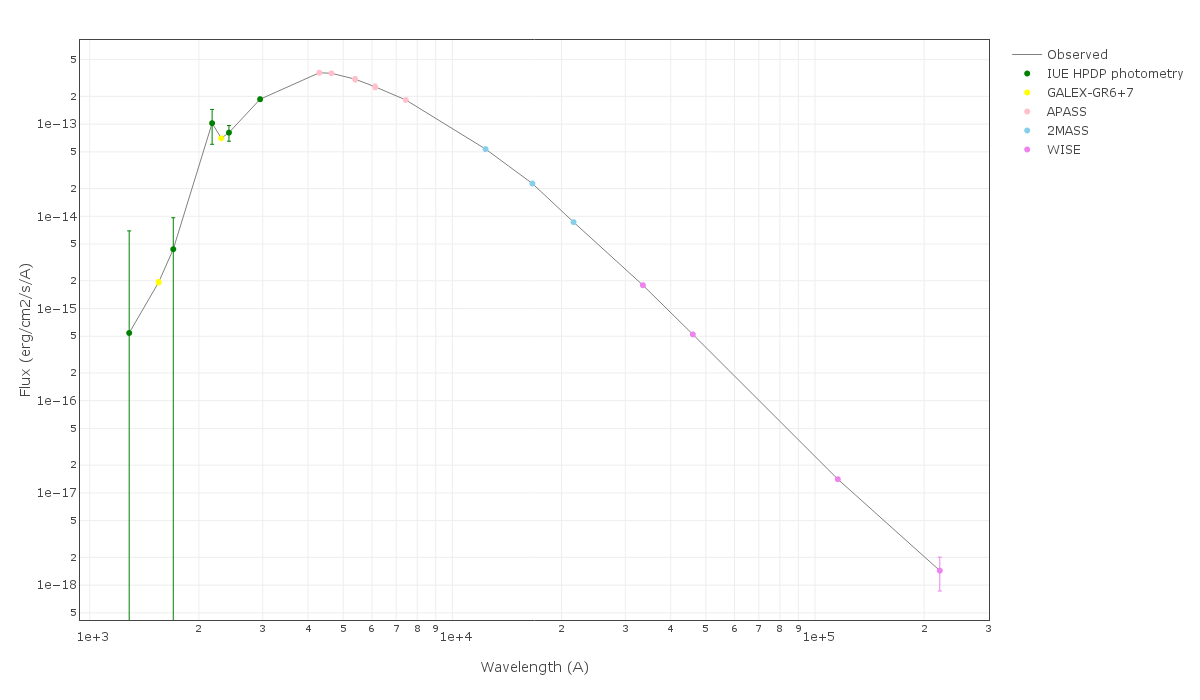
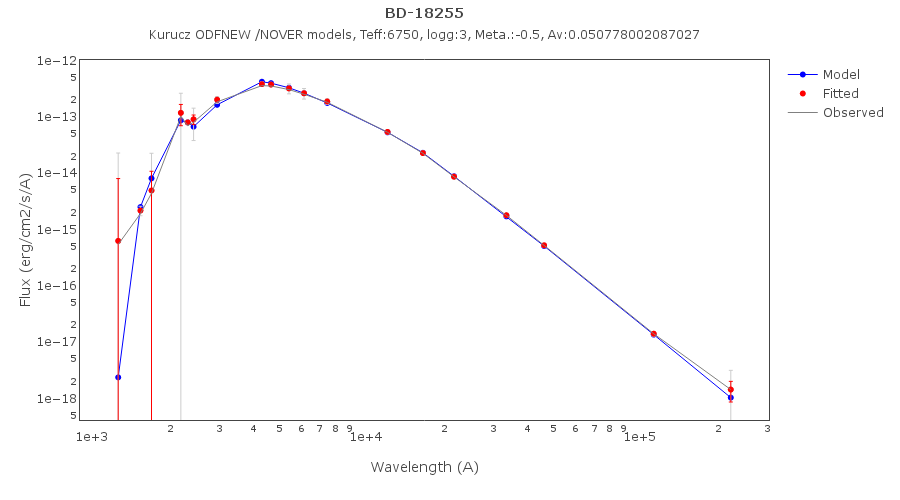
Goal: We want to check how the GALEX GR6+7 (Bianchi et al. 2017) FUV and NUV fluxes fit in the overall SED.
Methodology
- Input catalogue: IUE HPDP (1451 objects). This archive provides fluxes of INES spectra at different photometric bands.
- Crossmatch with GALEX GR6+7 (search radius: 5arcsec): 75 objects in common.
- Filtering
- Fafl=0 &Nafl=0 (good FUV, NUV photometry) --> 18 objects
- Good overall SED fitting --> 3 objects. (see below)
Conclusion:
- GALEX GR6+7 FUV and NUV fluxes fit well in the overall SED.
|


 Stellar libraries