Use Case: From SED fitting to Age estimation. The case of Collinder 69
[Introduction] [User data] [Upload file] [Model fit] [HR diagram] [Save Results]
HR diagram
In order to estimate values for the mass and age of our objects, we use a collection of isochrones and evolutionary tracks to build a HR diagram.
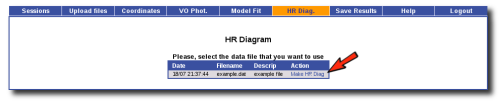
First, we access the HR diagram tag.
(click on the image to see full size)
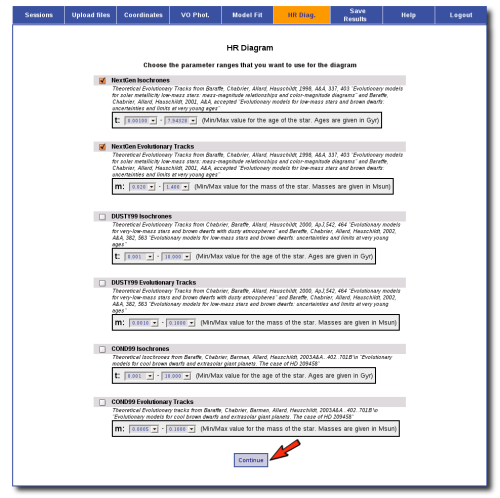
When we click in the Make HR diagram link, we are offered several collections of isochrones and evolutionary tracks and the available ranges of parameters for each of them.
In our case, given that the best model for our two objects are Nextgen and Kurucz, it does not make sense to use the COND and DUSTY models for the HR diagram. On the other hand, it must be noted that the Nextgen isochrones (and evolutionary tracks) can be used also for objects fitted by the Kurucz model.
Thus, we only mark the Nextgen collections and click on the Continue button.
(click on the image to see full size)
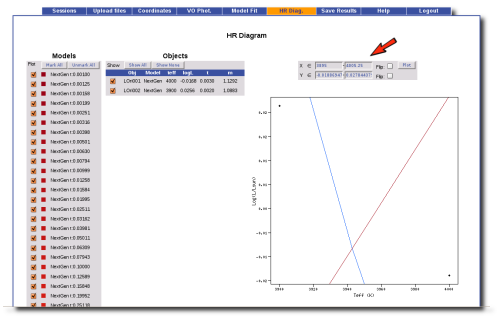
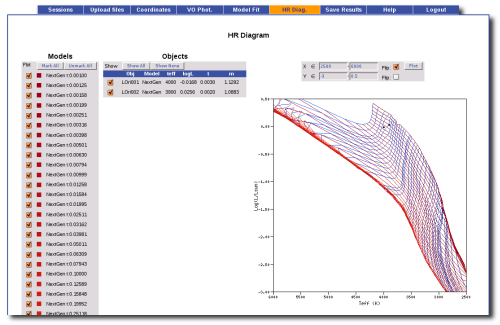
The application authomatically builds and HR diagram and, interpolating among the isochrones and evolutionary tracks, estimates values for both the age and the mass of our objects.
(click on the image to see full size)
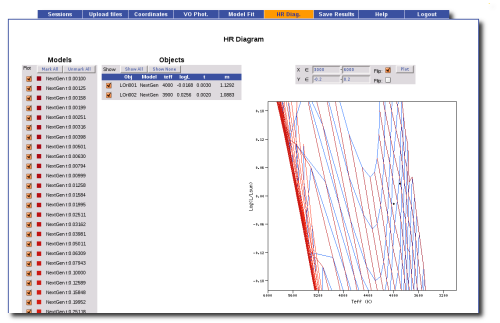
By default, the plot is zoomed so that it is focused in the object data points. But, while we are in this page, we can take some options for the graph: flipping axes, fixing the plot ranges, deciding which of the isochrones and evolutionary tracks we want to plot... In this case we flip the x axis and play with the plot ranges so that we get the graph as we like it.
(click on the image to see full size)
(click on the image to see full size)

(click on the image to see full size)
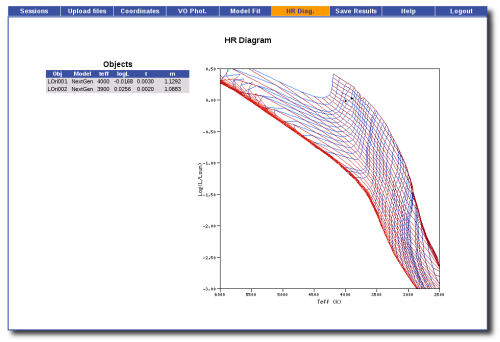
The next time we click in the HR diagram tab the Make HR diagram option will have dissapeared. Instead we can choose between seeing the saved results or delete them and start again. When we choose to see the results we can see them (but not modifying them).
(click on the image to see full size)
If we want to remake the plot, we can click in the Delete link instead and start the HR diagram again.
By this process we have estimated two more parameters for our objetcs: the age and the mass.
| Object |
Teff |
Log(G) |
Ftot |
Lbol/Lsun |
Age (Gyr) |
M/MSun |
| LOri001 | 4000 | 3.5 | 1.916e-10 | 0.955 | 0.003 | 1.1292 |
| LOri002 | 3800 | 4.5 | 2.048e-10 | 1.021 | 0.002 | 1.0883 |
|
|