Crossmatch of VO Stellar Libraries with TOPCAT
This is a simple tutorial on how to use TOPCAT to crossmatch VO catalogues and make some plots.
Index
TOPCAT
TOPCAT is a java application very useful to handle, edit and plot tabular data. Its aim is to provide most of the facilities that astronomers need for analysis and manipulation of source catalogues and other tables.
Installing and executing it is very easy. You can, for instance, download it as a java jar file or you can execute directly as a WebStart application just clicking a link.
In particular, TOPCAT offers the posibility to query VO services and handle the results.
If you download the jar file you tipically execute it just writing:
> java -jar topcat-full.jar
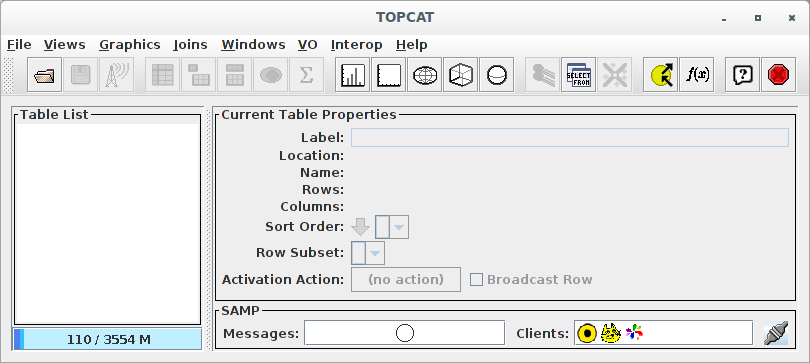
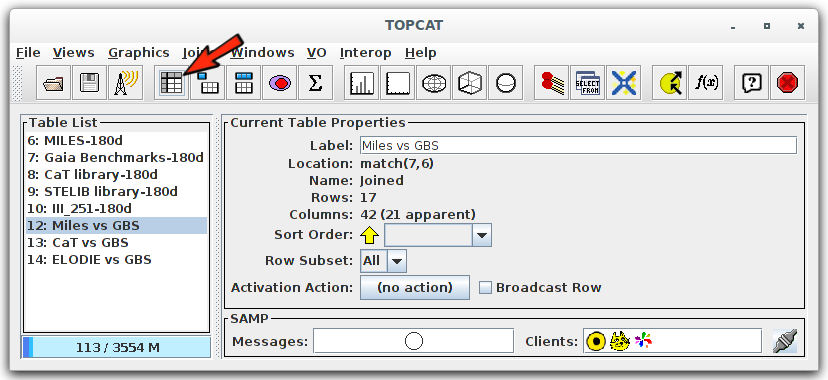
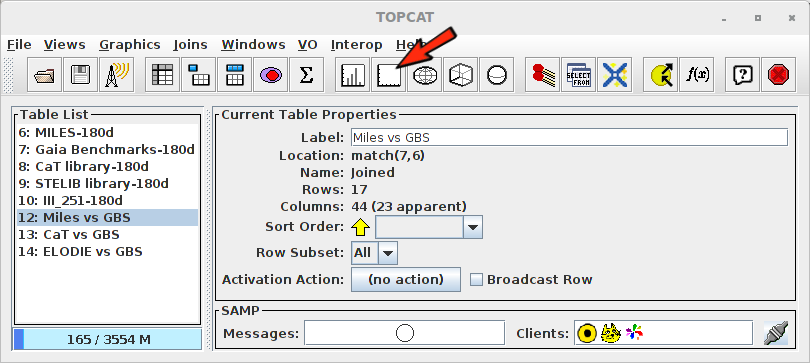
and you see the main TOPCAT window:
Downloading library data from VO services
We enter the "VO" menu and click in "Cone Search".
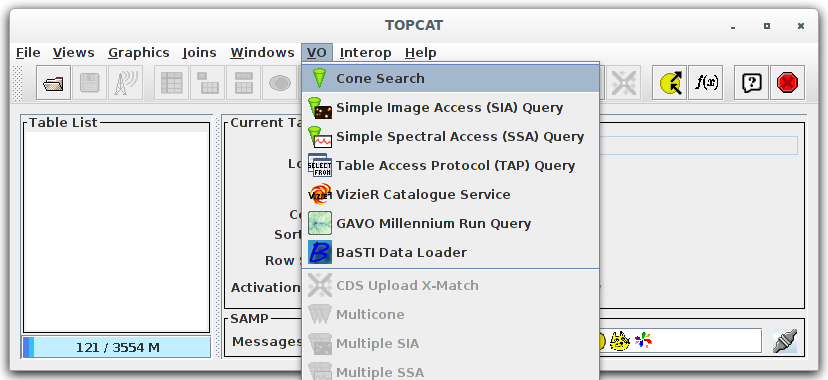
A new window opens to search for "Cone Search" services in the VO.
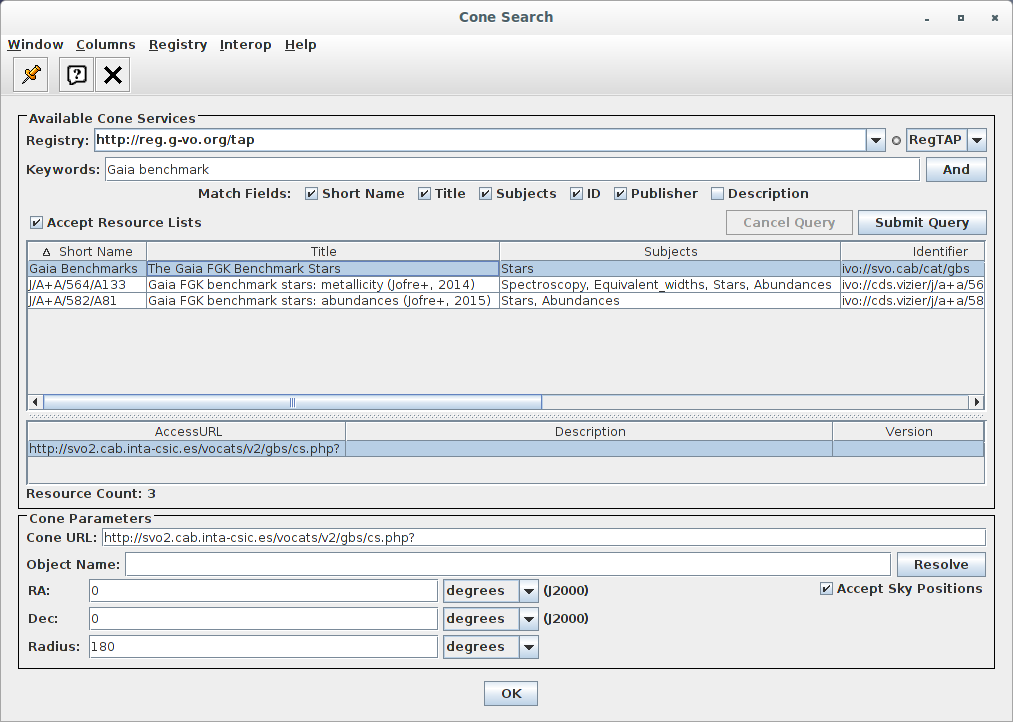
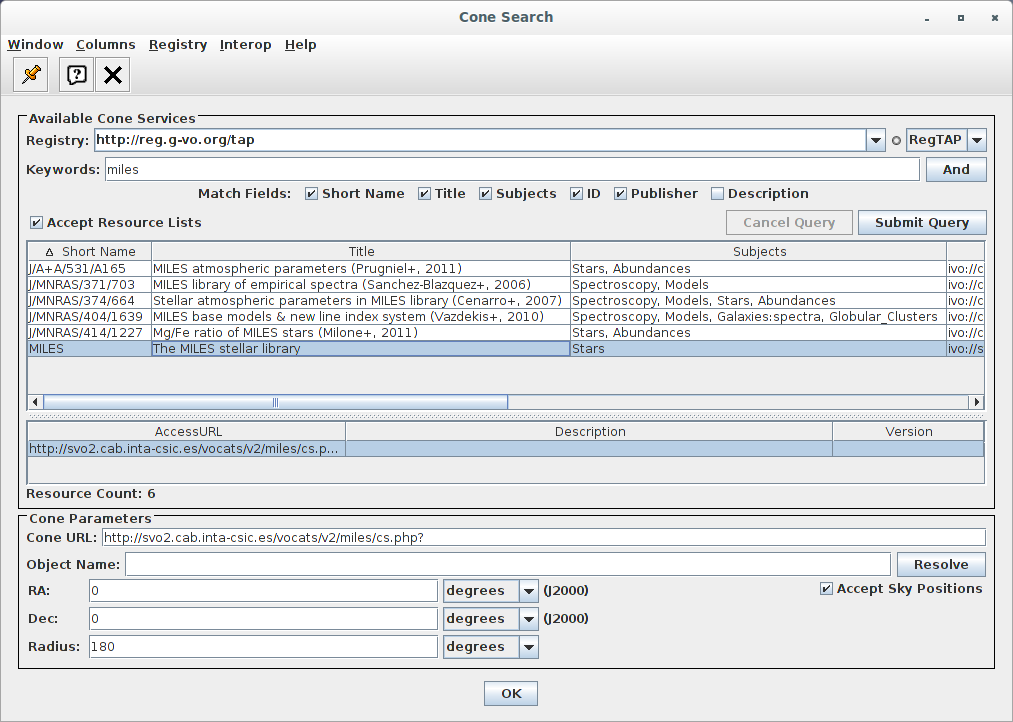
We use this form to search for the "GAIA benchmark stars" library:
- We write "Gaia benchmark" in the "Keywords" input and click in "Submit Query". A list of three available services appears.
- We select "The Gaia FGK Benchmark stars".
- Write RA=0, DEC=0 and Radius=180 in the "Cone Parameters" box below.
- Click "OK".
When we click "OK" the query is done and a new entry appears in the main TOPCAT window for the full content of this library.
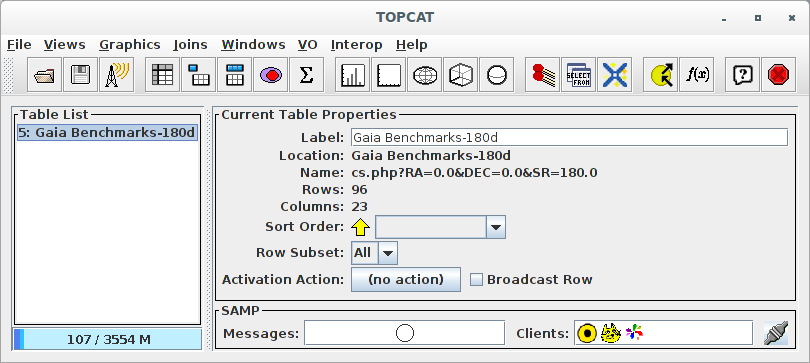
(We will play later with this table).
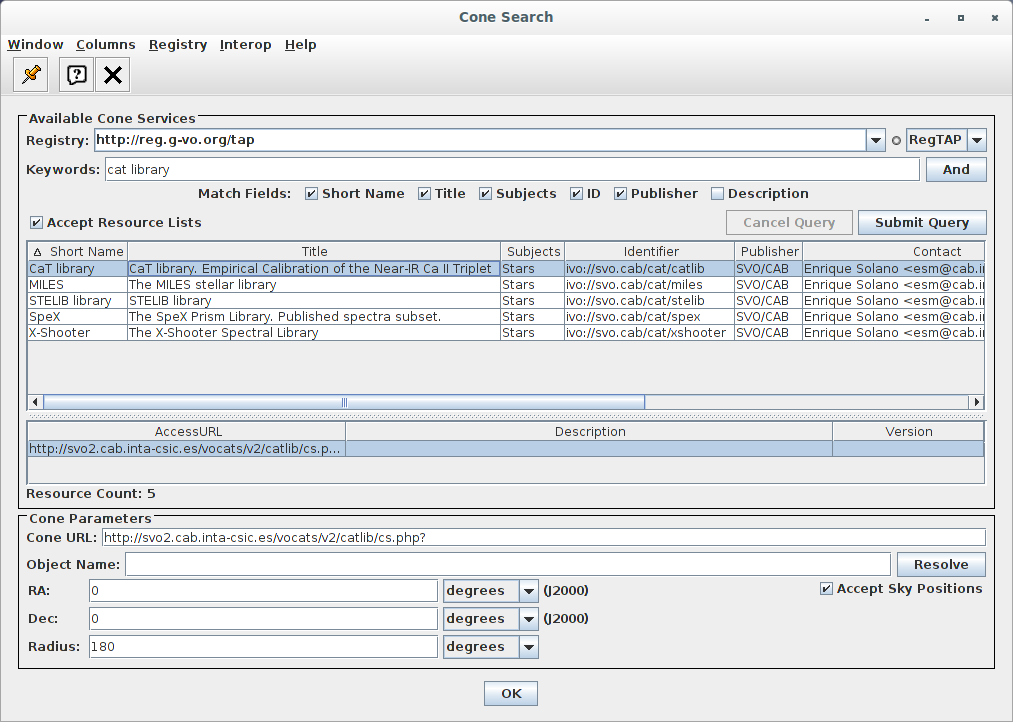
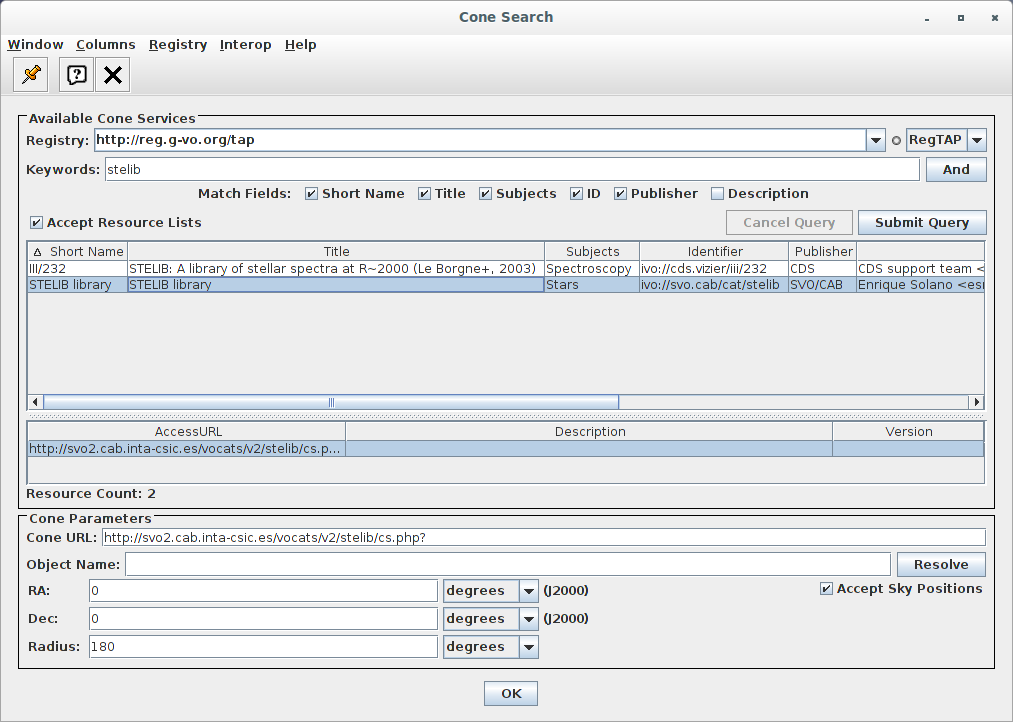
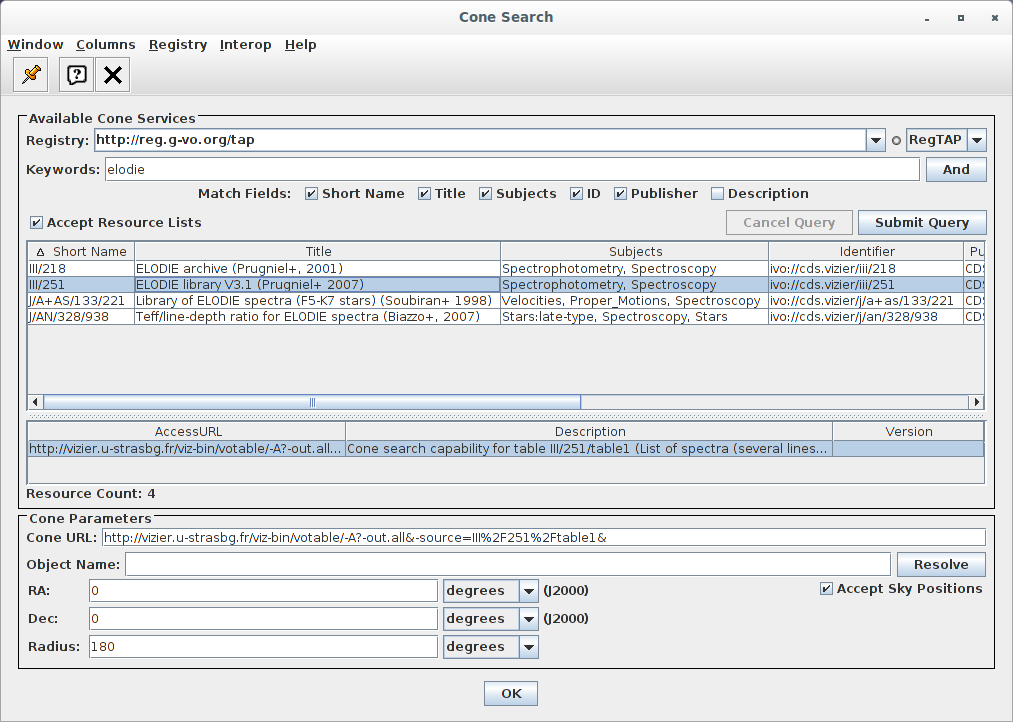
We repeat the operation to download other libraries. For instance, we download MILES, CaT, STELIB and ELODIE (catalogue III_251 in Vizier).
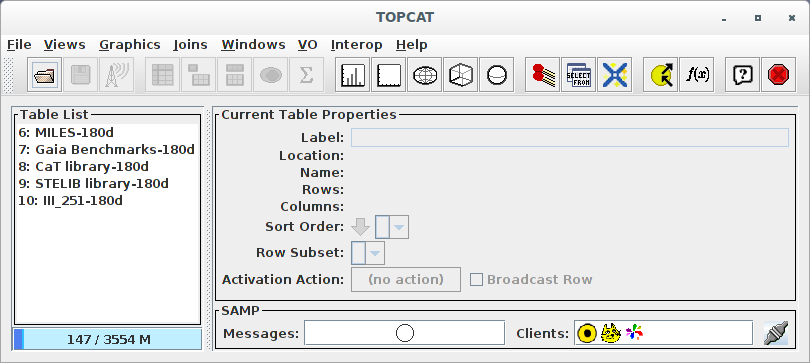
And we finally get all them available in TOPCAT:
Crossmatching tables
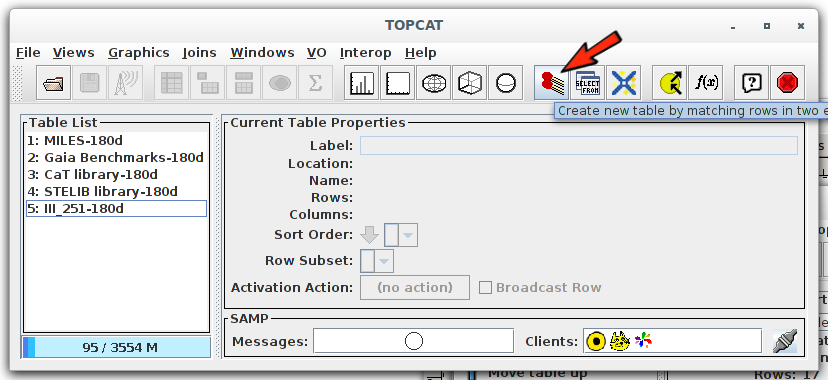
There are many ways in TOPCAT to crossmatch catalogues. We are going to use a simple one: selecting two tables and finding objects present in both tables.
In the main table we click in the icon showing two matches.
A new window opens. We select the "Gaia Benchmarks" table as "Table 1" and one of the other tables as "Table 2". We leave all the other options with the default values.
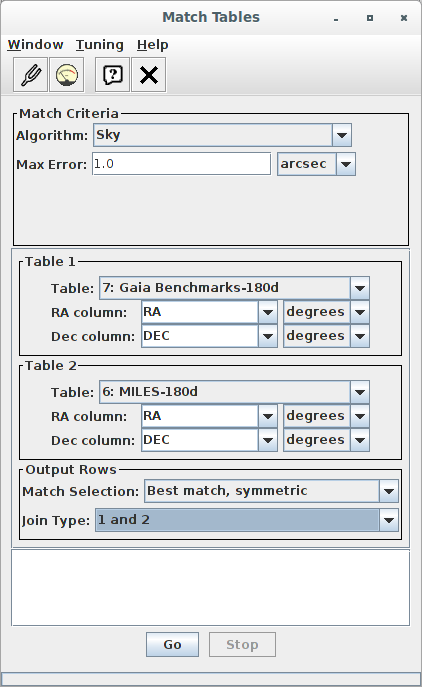
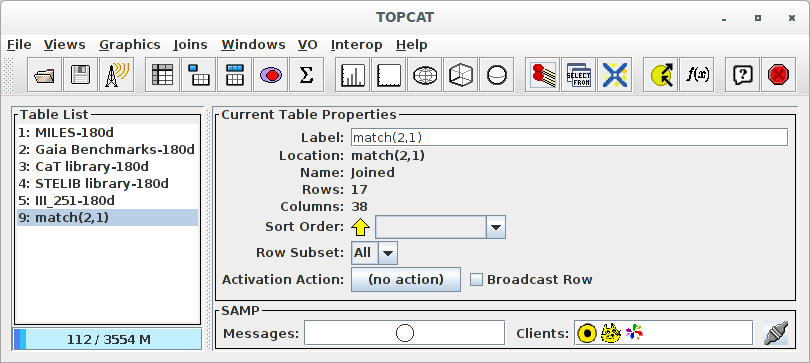
When we click "Go" a new entry appears in the list of tables.
We then repeat the same operation choosing other libraries as "Table 2". We do it for Cat and III_251 (ELODIE).
Simple table operations
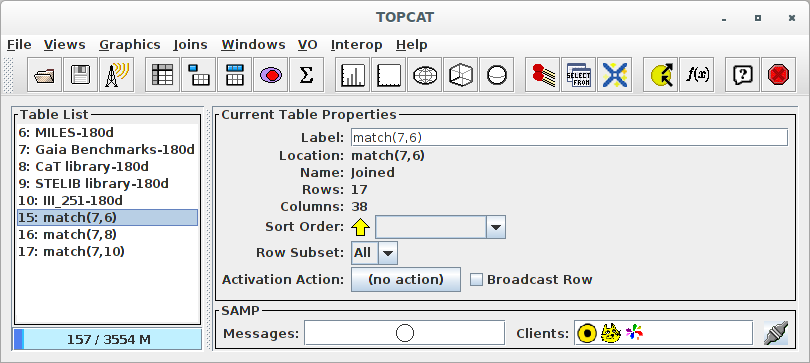
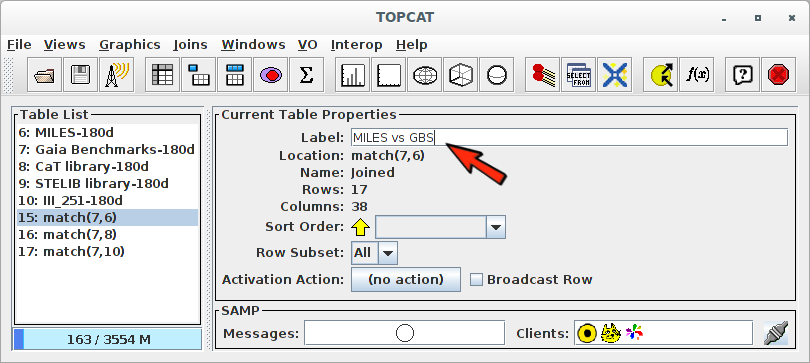
Rename tables
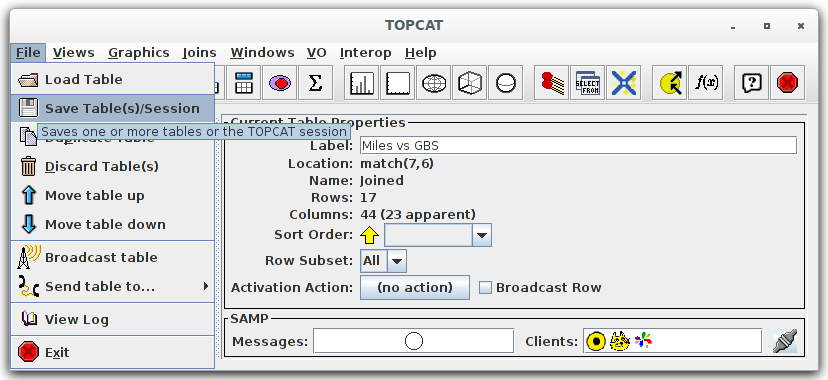
We could prefer to rename the crossmatch tables so that we remember better what they contain. In order to do that we just select one of them and change the "Label" on the right. We change "match(7,6)" (meaning "match of tables 7 and 6") to "MILES vs GBS" and click enter. Then we do likewise with the other two match tables.
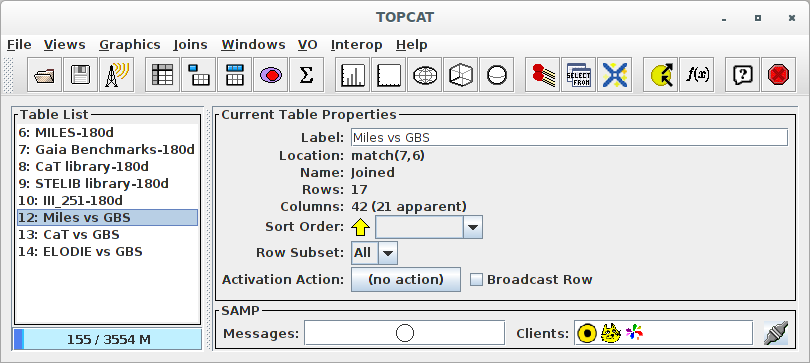
so that all tables have better names:
Hide/show columns.
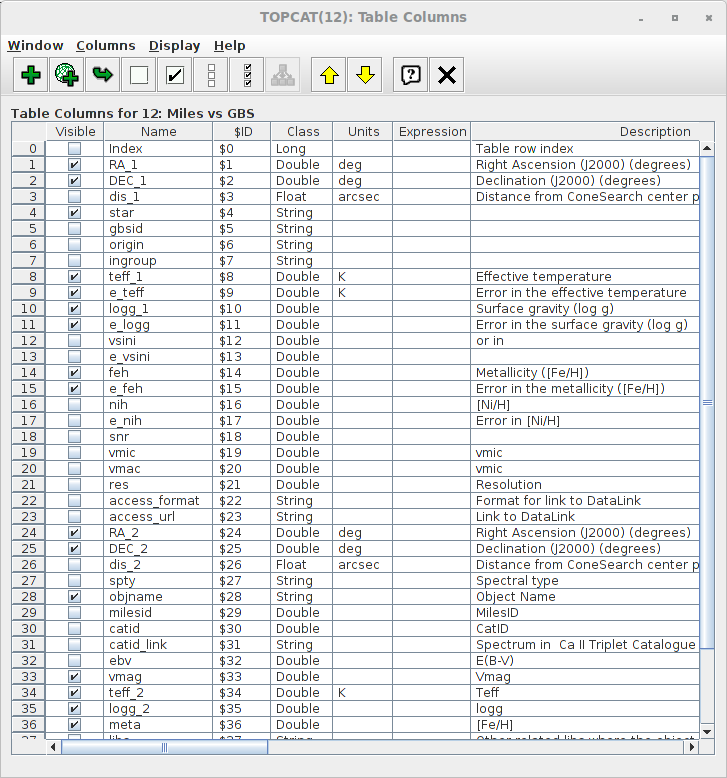
Each crossmatch table contains a lot of columns (all the columns in both catalogues). This can be unconfortable to visualize the table content but we can decide what columns to show using the "Views -> Column Info" menu (or just the corresponding icon).
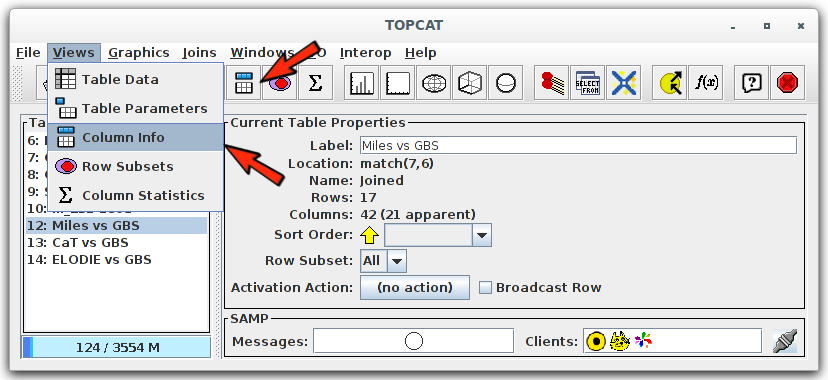
A new window opens with the list, and properties, of the table columns. For instance, for the "Miles vs GBS" table, we decide to show only the more relevant columns. In order to do that, we unmark the "Visible" column for all the properties that we want to hide.
You can see that TOPCAT, when crossmatchs two tables and there are common column names in both tables, labels the new columns with "_1" and "_2" to
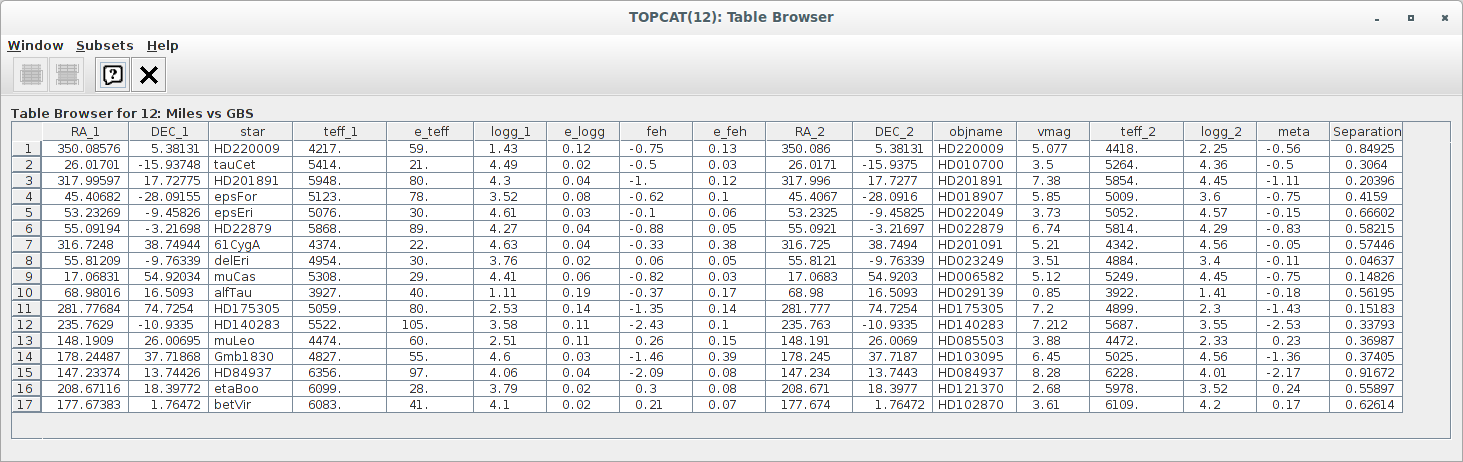
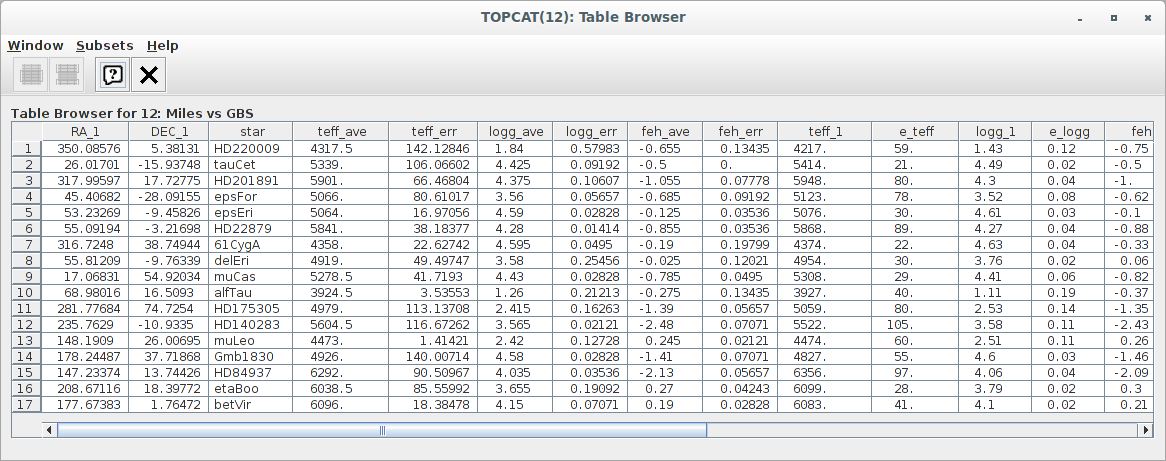
Visualize table content
To see all the content of a table, we select it and just click the corresponding icon.
Creating new synthetic columns
We want to add new columns to each crossmatch table so that we can do some statistics on the relevant parameters.
In particular, for each object, we want to calculate the mean value and standard deviation of the values of "teff" given by each catalogue. And the same for "logg" and metallicity.
In order to do that we visualize one of the crossmatch tables, use the right mouse button and click in "New synthetic Column".
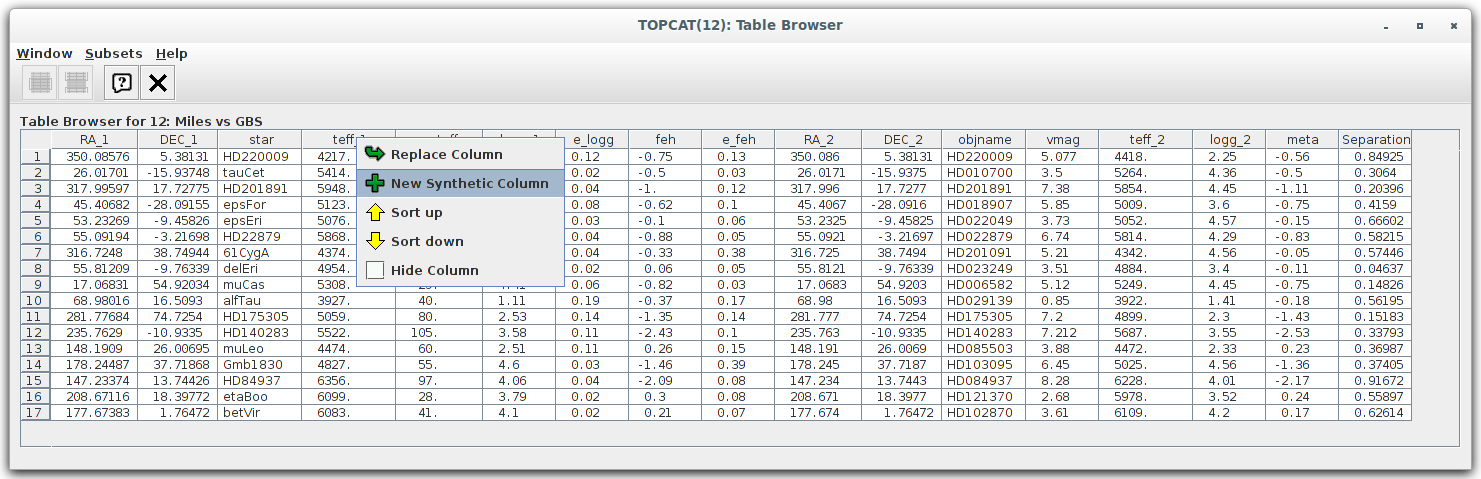
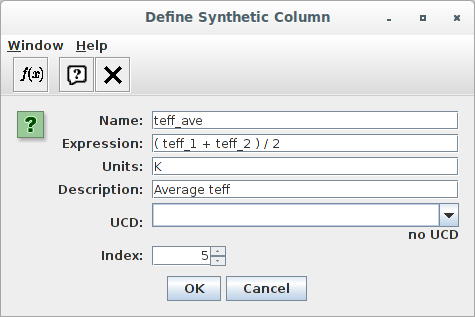
In order to do this, we have to give a new name for the new column and intruduce a mathematical "expression" to calculate the new column content in terms of other columns (using the names of these other columns).
We first define the column for the "teff" average value:
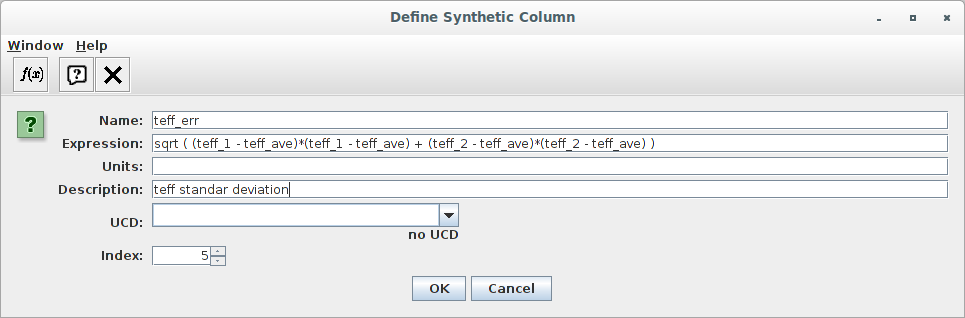
And then we create another column and we use this teff_ave column to calculate the standard deviation:
And we repeat the operation to define logg_ave and logg_err in a similar way.
Given that writing these long expressions from scratch is quite boring, we copy them here so that you can copy+paste them:
( teff_1 + teff_2 ) /2
sqrt ( (teff_1 - teff_ave)*(teff_1-teff_ave) + (teff_2-teff_ave)*(teff_2-teff_ave))
( logg_1 + logg_2 ) /2
sqrt ( (logg_1 - logg_ave)*(logg_1-logg_ave) + (logg_2-logg_ave)*(logg_2-logg_ave))
In the case that you want to do this also for the metallicity, the operation is a little trickier because the original columns have different names depending on the catalogue.
For "Miles vs GBS" you have to do:
( feh + meta ) /2
sqrt ( (feh - feh_ave)*(feh-feh_ave) + (meta-feh_ave)*(meta-feh_ave))
For "Cat vs GBS":
( feh_1 + feh_2 ) /2
sqrt ( (feh_1 - feh_ave)*(feh_1-feh_ave) + (feh_2-feh_ave)*(feh_2-feh_ave))
And for "ELODIE vs GBS" the operation is even trickier because the original name of the metallicity column in ELODIE is [Fe/H] which is not valid in the TOPCAT "Expression". In this case we can use the column number instead ($41 for [Fe/H] but you can seel the column numbers in the "Views -> Column Info" menu).
( feh + $41 ) /2
sqrt ( (feh - feh_ave)*(feh-feh_ave) + ($41-feh_ave)*($41-feh_ave))
Once we have done all this, we have the new columns that we need for further analysis and we can go on (they can appear in different positions in the table, but it doesn't matter, and you can always drag a column to reposition it if you want).
Making plots
We want to make a plot with Teff vs logg for each library, using the average values for the points and the standard deviations for the error bars.
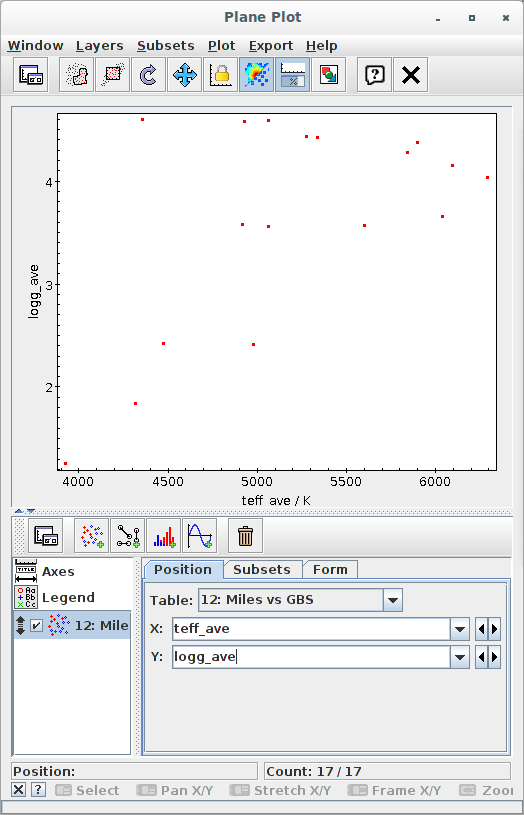
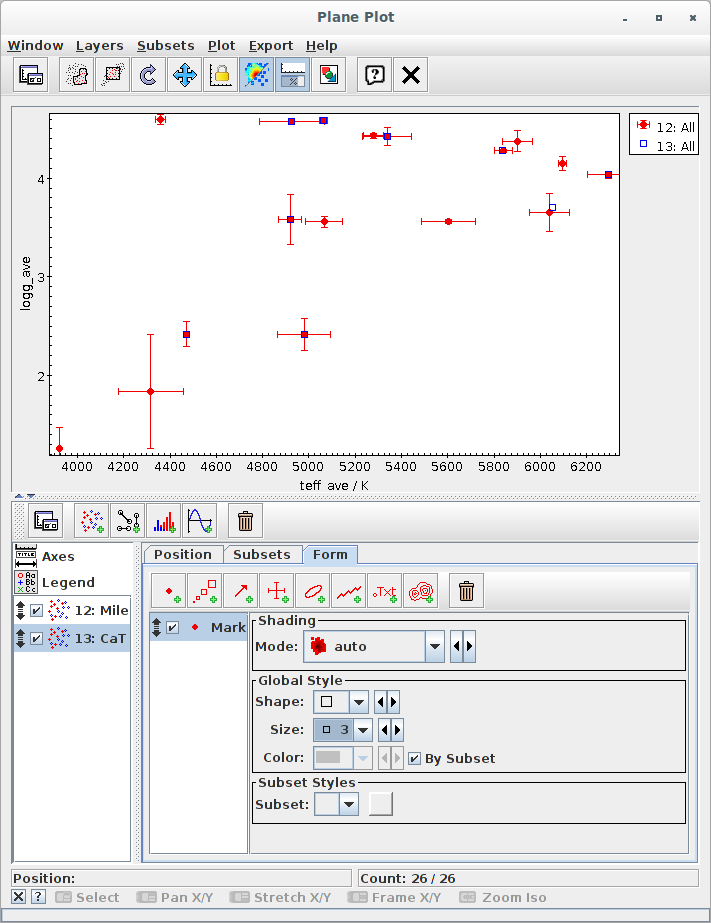
First we select a crossmatch table and click in the "Plane Plot" icon.
A new window opens for the plot. We select "teff_ave" for the X axis and "logg_ave" for the Y axis.
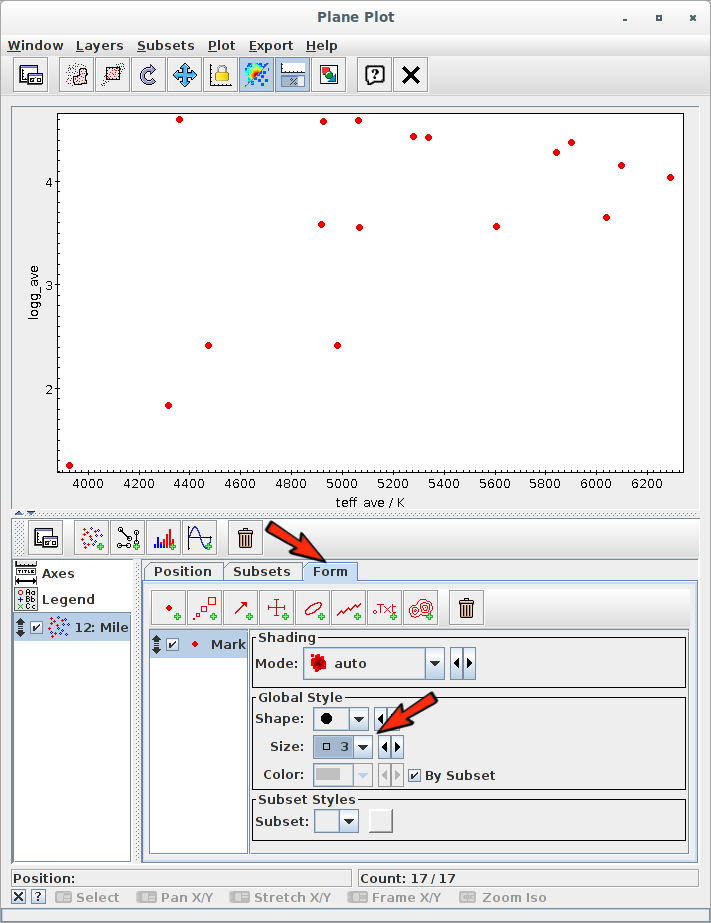
Then we click on the "Form" tab to change the style. We choose bigger points (size=3).
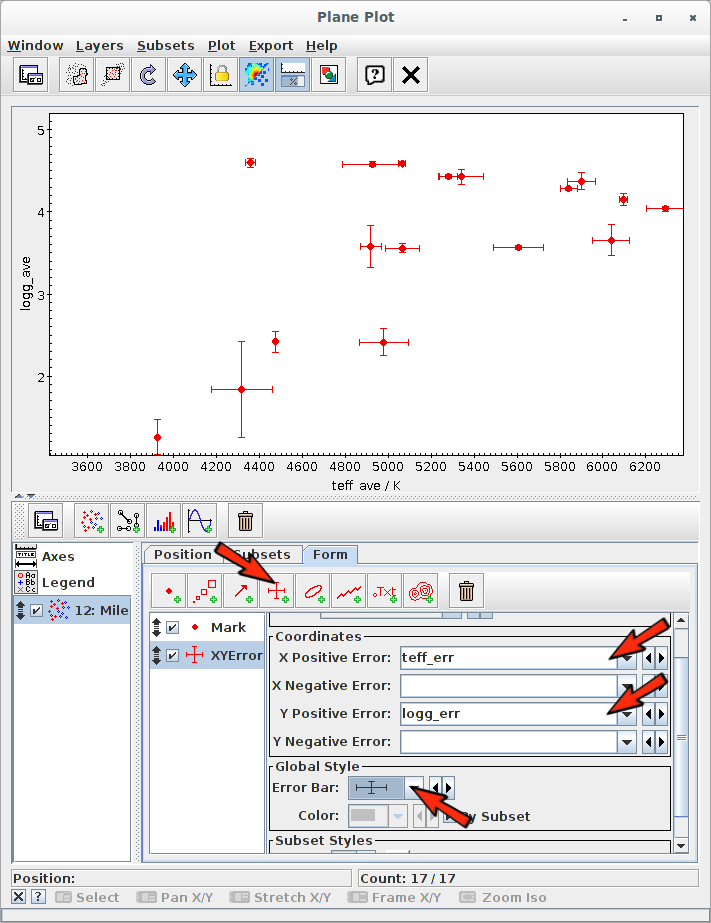
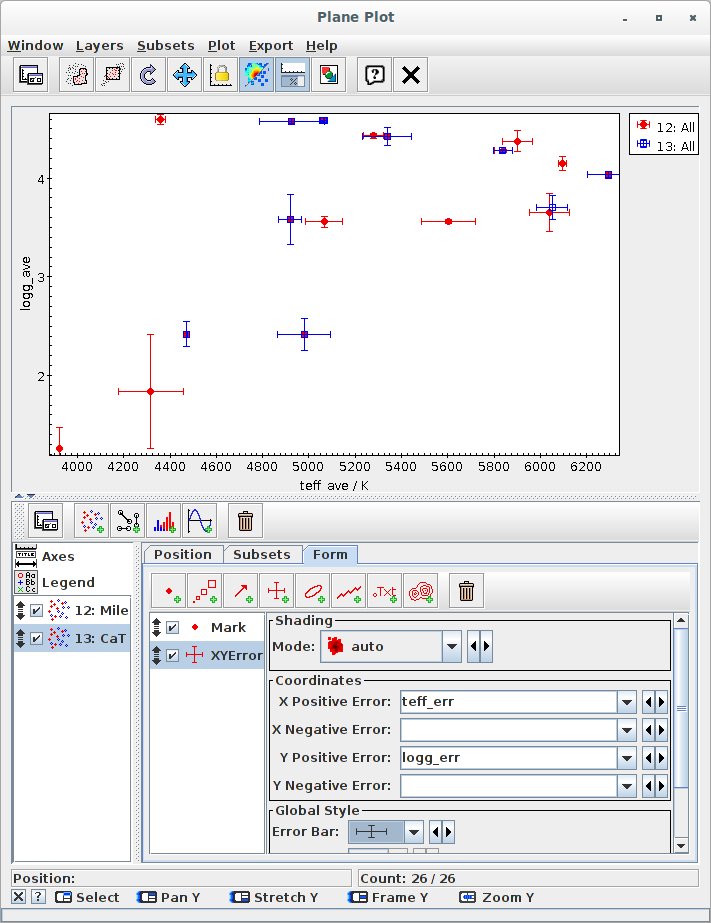
To include the error bars, we click in the corresponding icon, select "teff_err" for the X error and "logg_err" for the Y error. And we also change the style for the error bars.
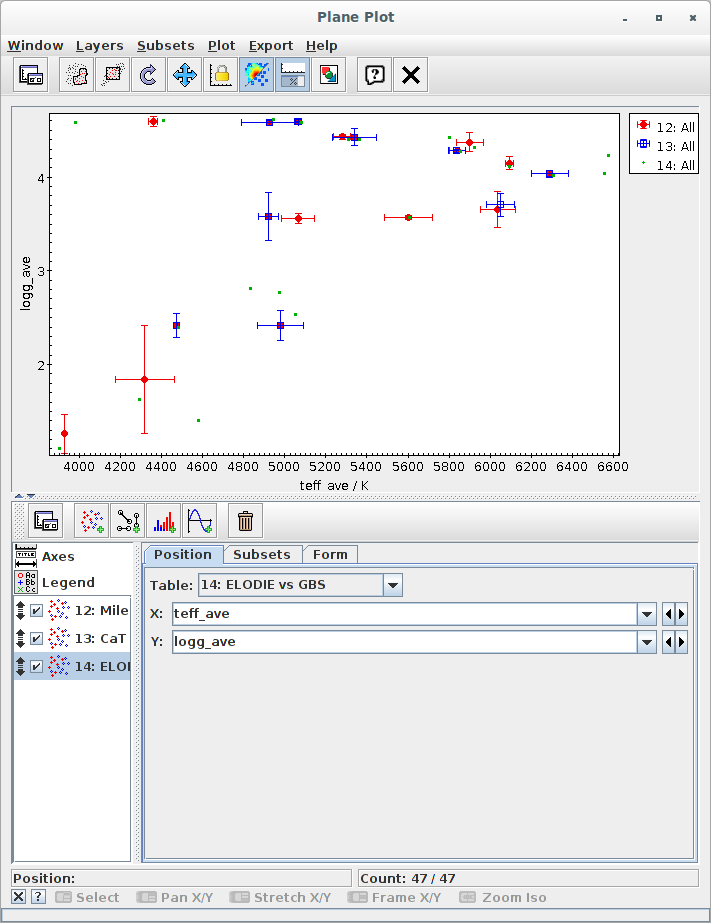
To include a new set, we click in the corresponding icon, select a different table and "teff_ave" for X and "logg_ave" for Y.
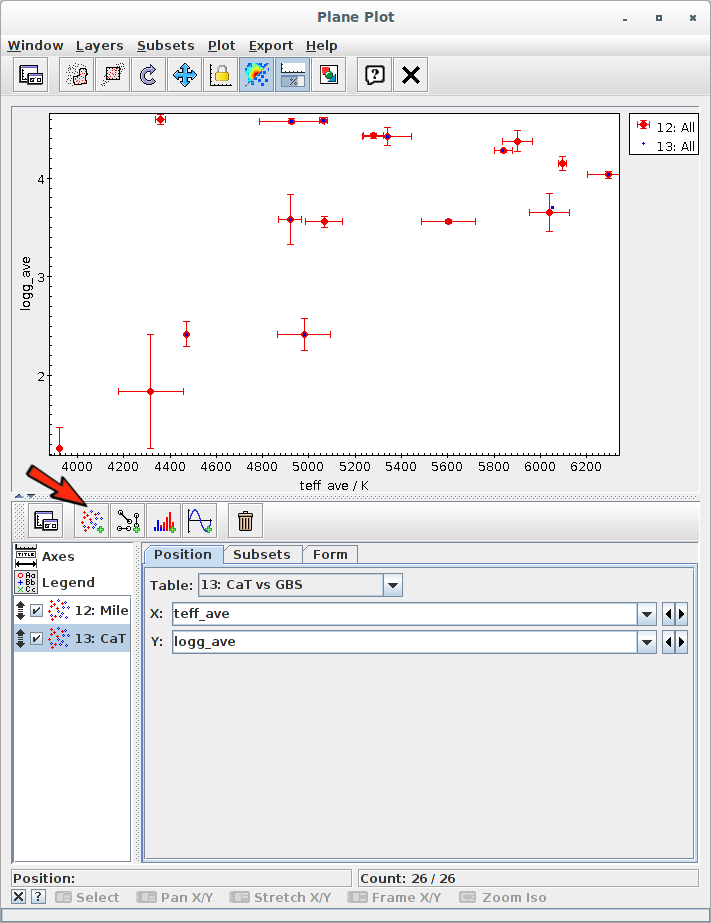
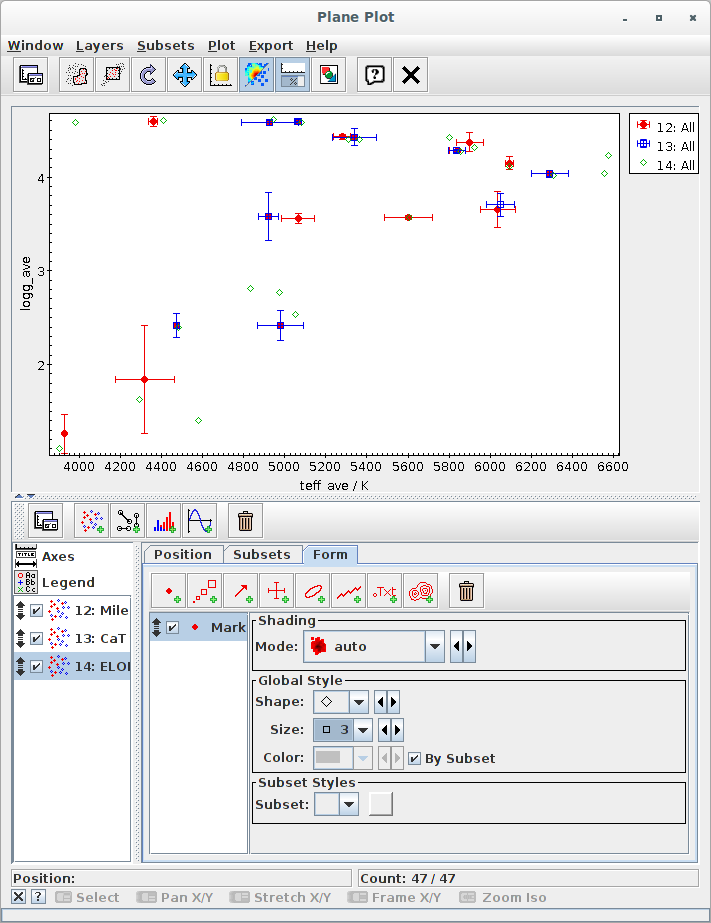
Then we style this set and define the error bars in the "Form" tab.
And repeat all these operations to include the remaining crossmatch table.

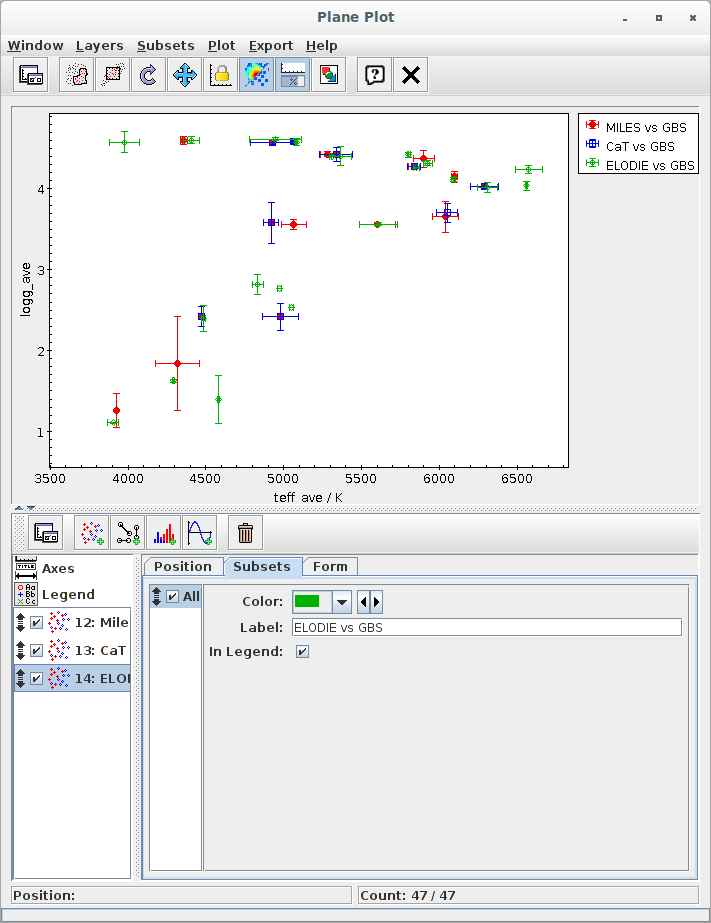
Finally, we can set the labels that appear in the Legends. To do that we select a table and use the "Subsets" tab.
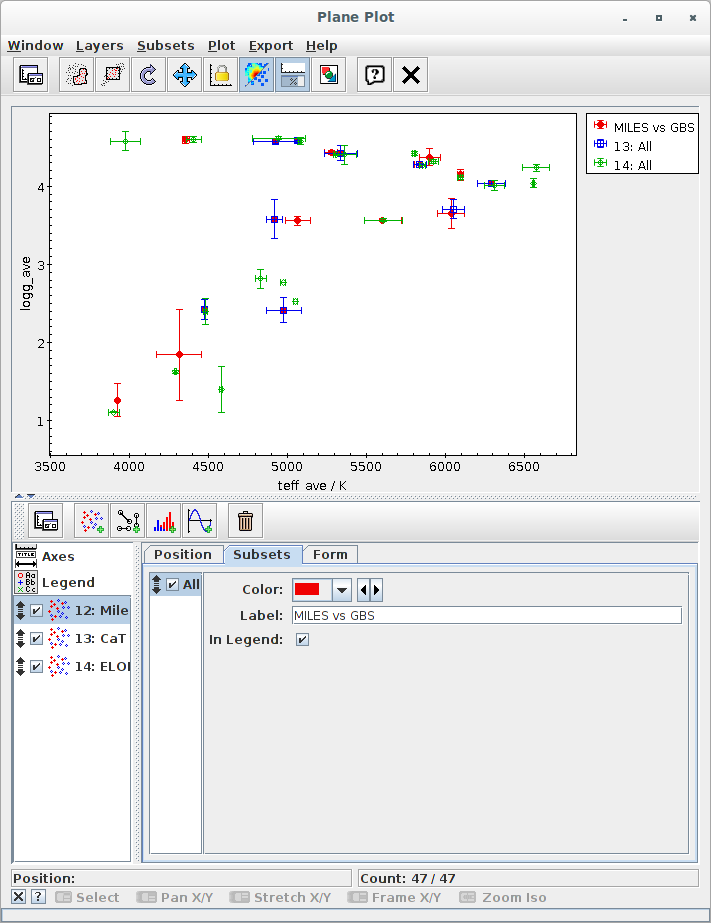
We repeat this operation for all the sets.
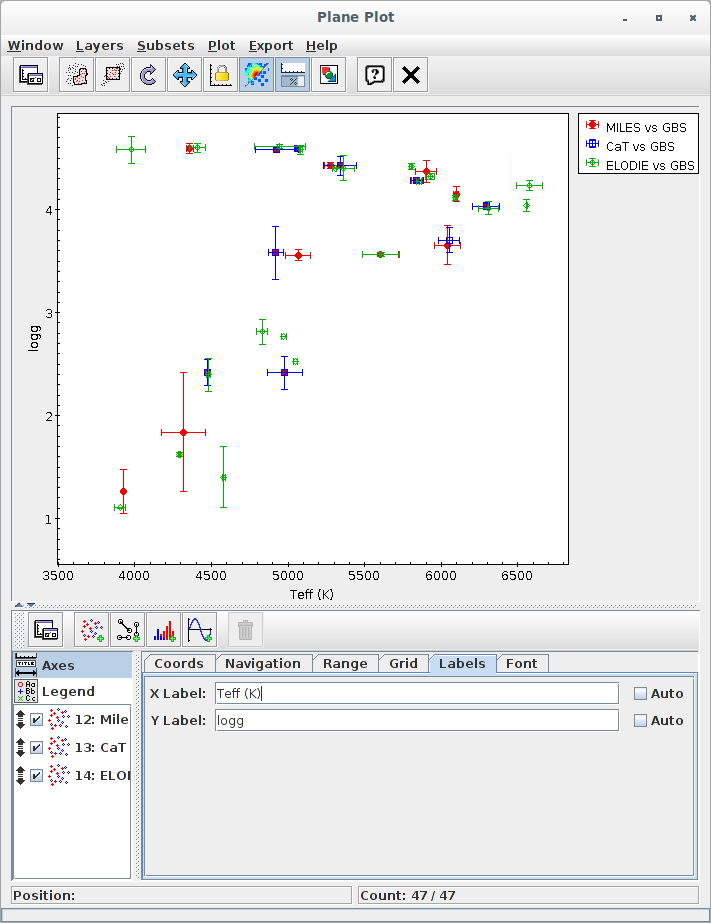
And, finally, we can also change the axis labels clicking on "Axes" -> "Labels".
Downloading/saving data
At any point you can export any table and save the corresponding data to a file.
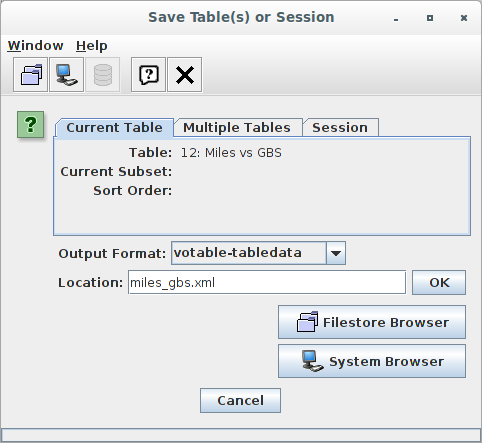
Just select a table, use the "File -> Save Table(s)/Session"
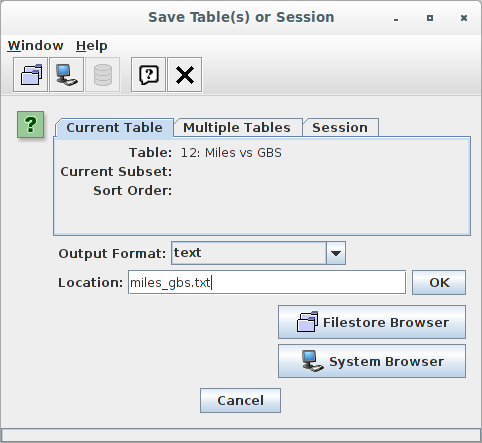
You have to give a name to the output file and select a format. There are many formats available. "votable-tabledata" is probably the most adequate for VO purposes and the best one if you intend to load it again in TOPCAT another day. "text" is probably the most human-friendly. "CSV" could be very useful for many purposes. In any case, you can try all the formats and see which one is better for you.

Finally, you can also save the whole session using the "Session" tab. Select fits-plus as format and give some name to the output file.
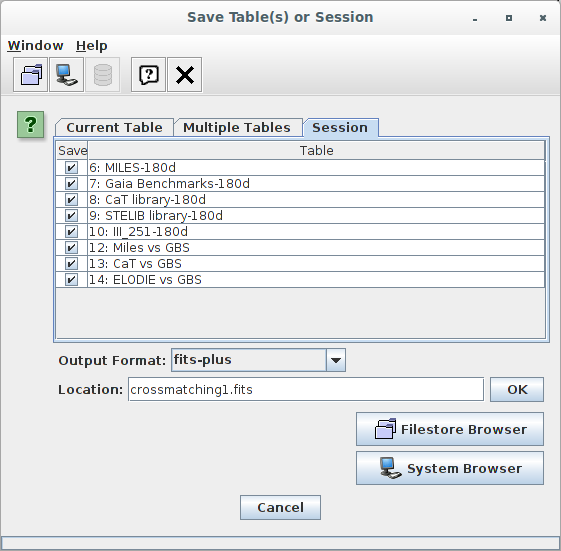
Then, you can close TOPCAT, open it again some other day and load this file to recover all the tables.